

Question: Which depreciation method does Target Corporation use for reporting in the financial statements? What type of depreciation method does the company probably use for income
- Which depreciation method does Target Corporation use for reporting in the financial statements? What type of depreciation method does the company probably use for income tax purposes?
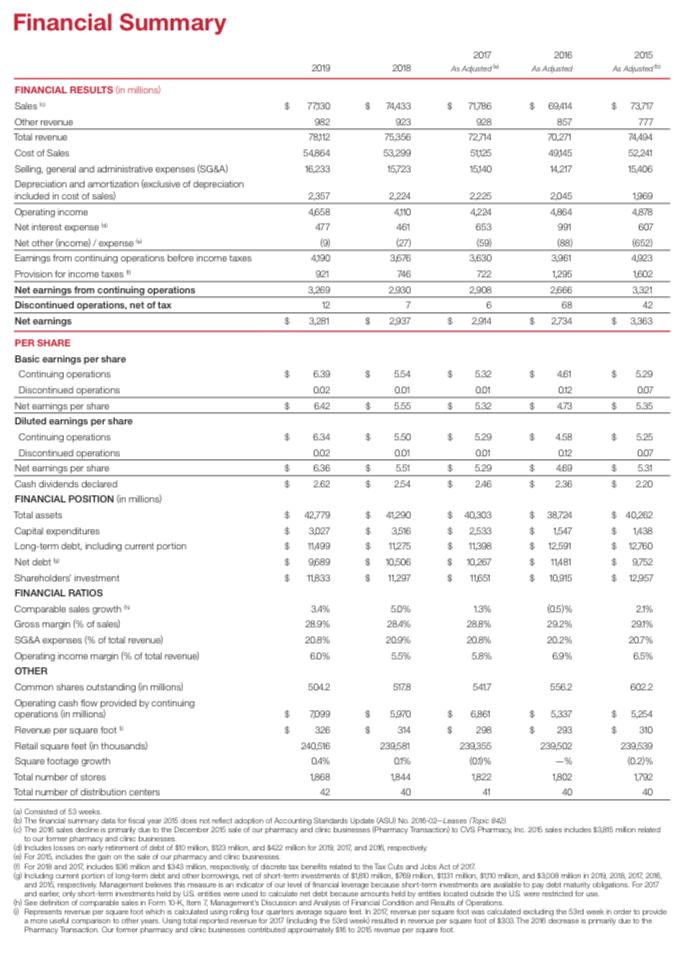
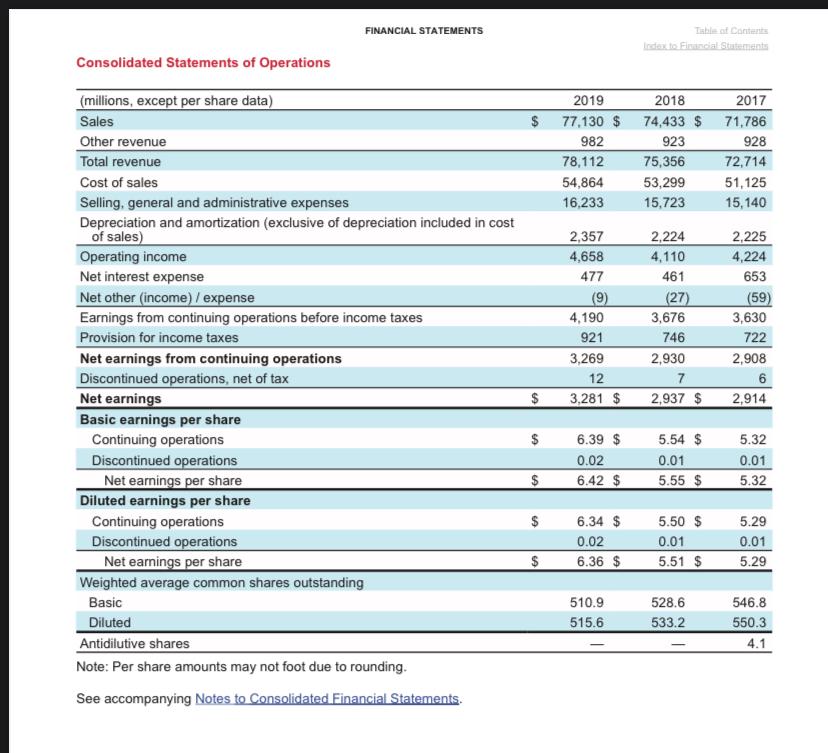
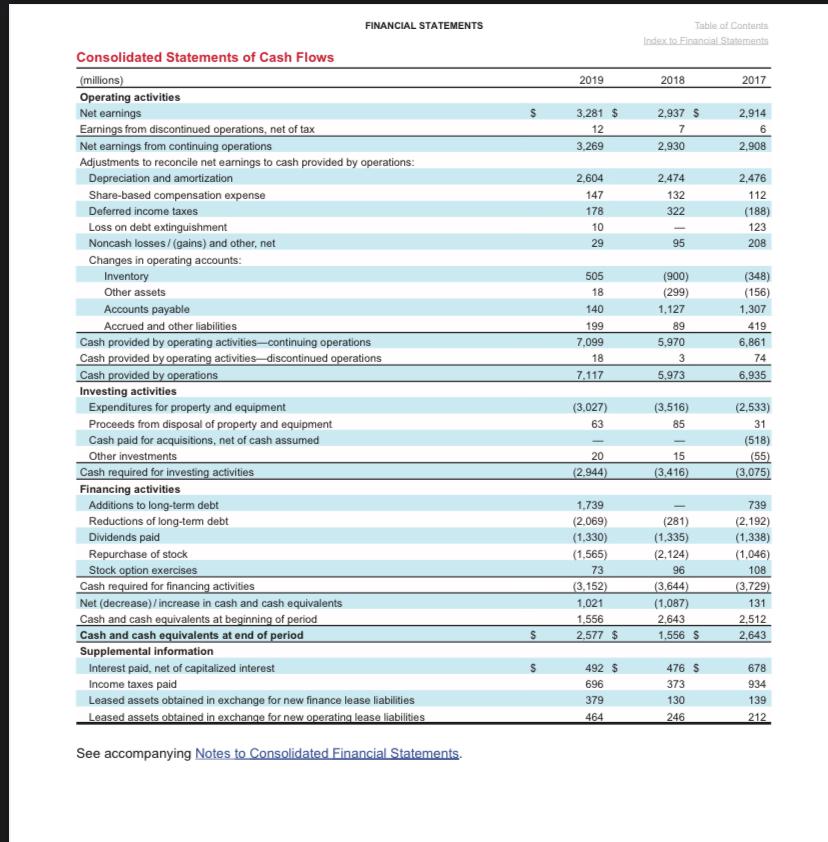
- What was the amount of depreciation and amortization expense for the year ending February 1, 2020?
- The statement of cash flows reports the cash purchases of property, plant, and equipment. How much were Targets additions to property, plant, and equipment during the year ending February 1, 2020? Did Target record any proceeds from the sale of property, plant, and equipment?
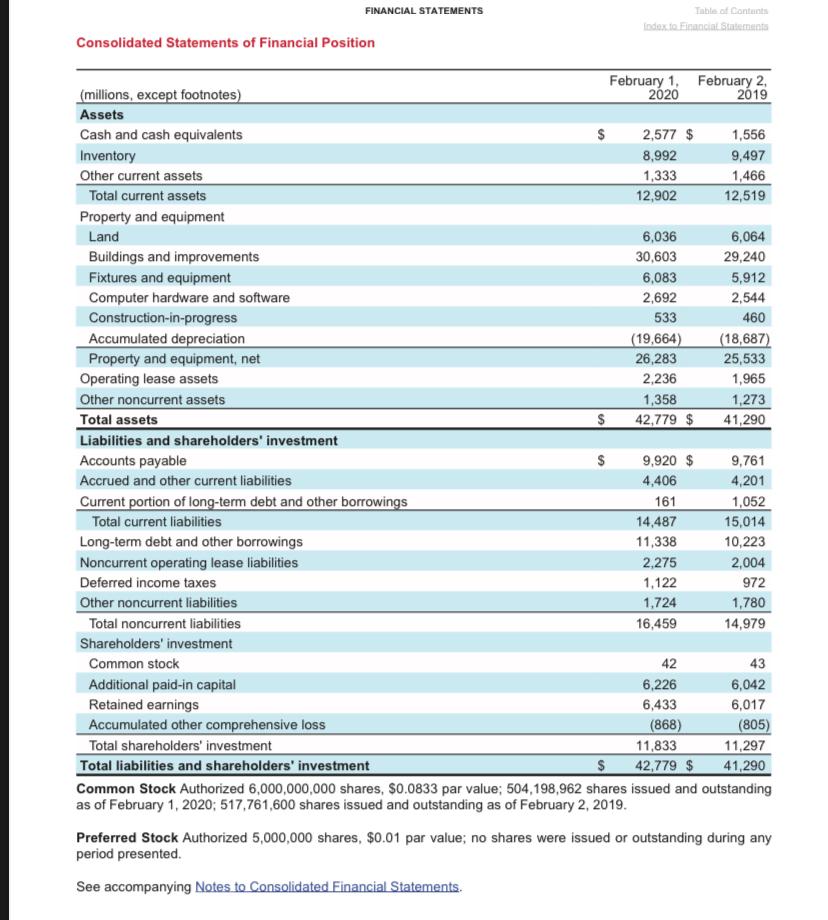
- What was the amount of accumulated depreciation on February 1, 2020? What was the net book value of property, plant, and equipment for Target as of February 1, 2020?
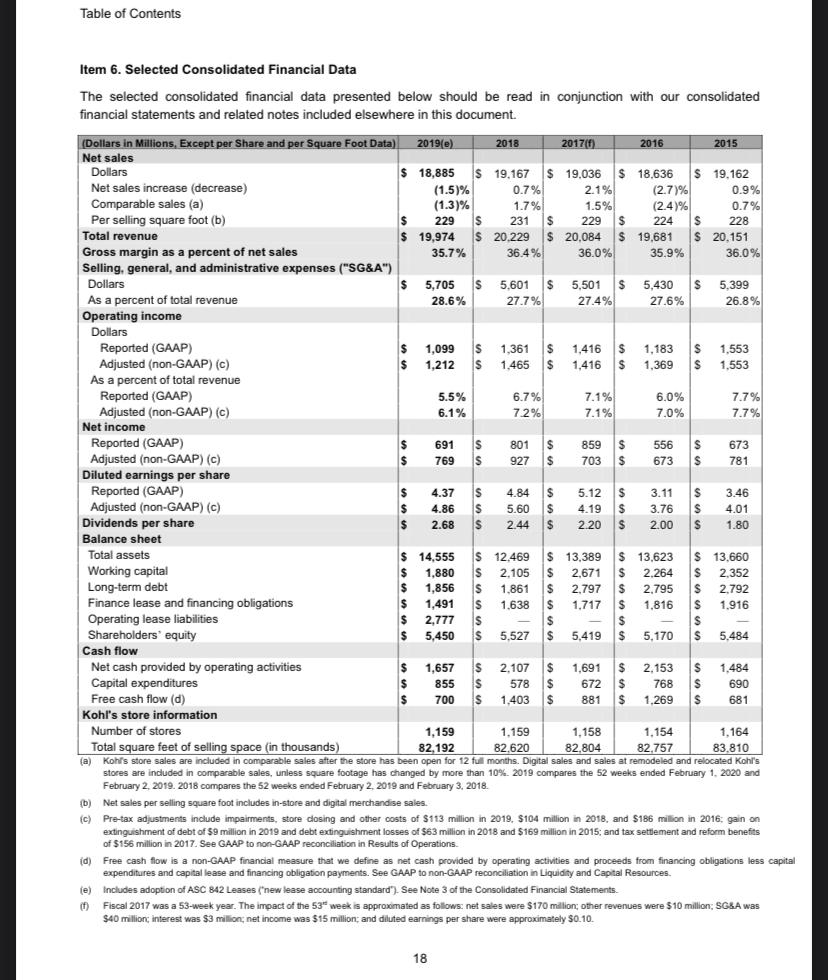
- Compute Targets asset turnover ratio for the year ending February 1, 2020. Round to two decimal places. How does Targets ratio compare with that of Kohls Corporation?
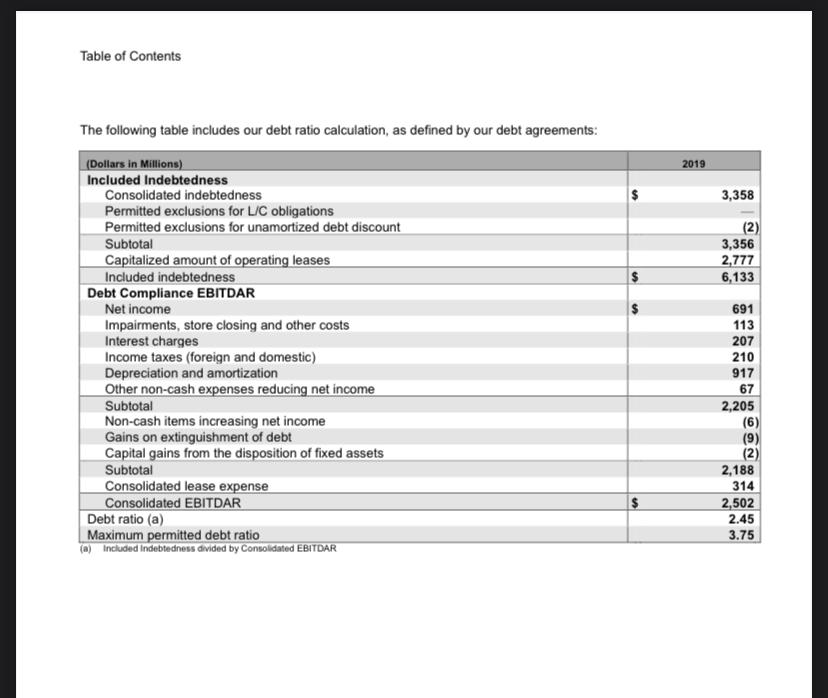
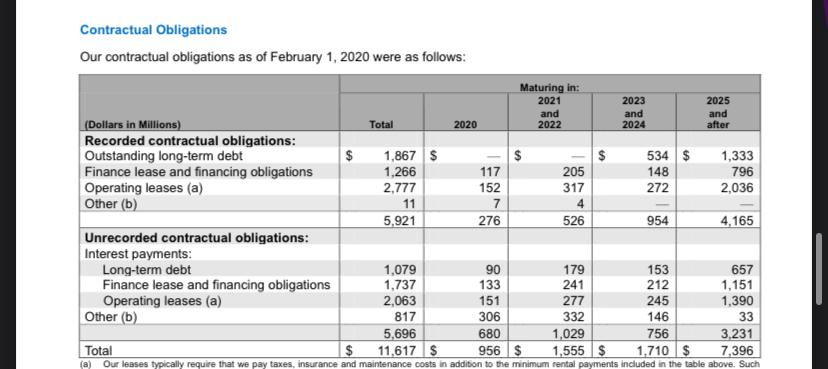
Financial Summary 706 2017 2016 2015 2019 2018 As Adusted As dit FINANCIAL RESULTS in millions Sales $ 77130 S 74433 $ 74786 $ 89,414 $ 73.717 Other revenue 982 23 928 857 777 Total revenue 78312 75356 72714 70.271 74494 Cost of Sales 54864 53.299 51125 49345 52241 Selling, general and administrative expenses (SGBA) 16.233 15723 15340 1217 15,406 Depreciation and amortization exclusive of depreciation included in cost of sales) 2.357 2.224 2225 2045 1960 Operating income 4658 4110 4,224 4864 4878 Not interest expen 461 653 991 BOZ Net other income /expense ) 19 (27) (59) (88) 1662 Earnings from continuing operations before income taxes 3,575 3630 3.961 2008 4 Provision for income taxes 722 1,225 1002 Net earnings from continuing operations 3.269 2930 2.908 2666 3321 Discontinued operations, net of tax 12 7 6 68 42 Net earnings $ 3,281 S 2,937 $ 2914 $ 2734 $ 3.363 PER SHARE Basic earnings per share Continuing operations $ 6.39 $ 554 $ 522 $ 461 $ 529 Discontinued operations 002 0.01 po 001 012 OOT Net carrings per share $ 642 $ 5.55 $ 532 $ $ 535 Diluted earnings per share Continuing operations $ 6.34 $ 5.50 $ 529 $ 458 $ 5.25 Discontinued operations 002 001 001 012 007 Net earnings per share $ 6.36 551 $ 529 $ 480 531 Cash dividends declared $ 262 $ 254 $ 246 $ 2.36 $ 220 FINANCIAL POSITION in millions) Total assets $ can 42,779 $ 1200 $40.303 $ 38,721 $40.262 Capital expenditures $ 3027 $ 3546 $ 2583 $ 1547 $ 1438 Long-term debt, including current portion $ 1499 $ 11275 $ 11398 $ 12.591 $ 1270 Not debt $ 9689 $ 10,506 S 0.267 $ 11481 Shareholders investment $ 11833 $ 11297 $ 11651 $ 10,915 $12.957 FINANCIAL RATIOS Comparable sales growth 34% 50% 139 10.5% 21% Gross margin 1% of sales 28.9% 284% 28.8 29.2% 291% SGBA expenses (% of total revenue) 20.8% 209% 20.8% 20.2% 207% Operating income margin % of total revenuel 60% 5.5 589 6.9% 6.5% OTHER Common shares outstanding in milions 5042 578 5617 5562 8022 Operating cash flow provided by continuing operations in millions) 7099 3 5.970 $ 6861 $ 5337 Rovern per square foot $ 326 $ 314 $ 298 $ 293 $ 310 Retail square foot in thousands) 240.596 239,581 232356 220.502 2293 Square footage growth 04% 099 102% Total number of stores 1868 1844 1822 18 1732 Total number of distribution centers 42 40 41 40 A Cand of 53 weeks The francia summary data for fiscal year 2015 does not meet adoption of Accounting Standards Update US No 2016-03-31 The 2013 se dodir is proud to the December 2015 se of sur sharmacy and cric business Parmacy Transaction CVS Pharmacy, Inc. 206 si dudes $35 milion related to our former pharmacy and clinic bune daudessa on sarly retireret af det of $10 miliona mion, and 22 milion for 2018 2017 and 20th For 2014 includes the gain on the sale of our pharmacy and for 20 and 20% includes 6 milion and 33 minspective of doc tax bereits and to the Tax Cuts and Jobs Act of 2017 al housing and portion of long-term and other borrowingsnet of short-terment of Orion, 1 milion 131 milion milion and $300 milion in 2012, 2011, 2012 2011 and 20 spec Moragon ball this mature is an indicator of our vel francia bude short motsar www to paydot matunity bigations For 2017 and saler, only short hold by US cities were used to count det because oursed by its based outside the US were restricted for Dal See detition of comparable sn Form Doktor Management Discum and Aros otroncal Condition and Results of Operations @Regree per foot which is calculated using ring for more square out in 2017, per un todoxuding the 53rd order provide a more comparson to the years. Using total reported for 2017 including the world never person foot of $300 The 2018 decrease pray due to the Pharmacy Transaction. Our or pharmacy and intunes contributed approximately 16 to 2015 por groot FINANCIAL STATEMENTS Table of Content Consolidated Statements of Operations $ 2019 77,130 $ 982 923 2018 2017 74,433 $ 71,786 928 75,356 72,714 53,299 51,125 15,723 15,140 78,112 54,864 16,233 2,357 4,658 477 (millions, except per share data) Sales Other revenue Total revenue Cost of sales Selling, general and administrative expenses Depreciation and amortization (exclusive of depreciation included in cost of sales) Operating income Net interest expense Net other (income) / expense Earnings from continuing operations before income taxes Provision for income taxes Net earnings from continuing operations Discontinued operations, net of tax Net earnings Basic earnings per share Continuing operations Discontinued operations Net earnings per share Diluted earnings per share Continuing operations Discontinued operations Net earnings per share Weighted average common shares outstanding Basic Diluted Antidilutive shares Note: Per share amounts may not foot due to rounding. See accompanying Notes to Consolidated Financial Statements. 4,190 921 3,269 12 3,281 $ 2,224 4,110 461 (27) 3,676 746 2,930 7 2,937 $ 2,225 4,224 653 (59) 3,630 722 2,908 6 2,914 $ 6.39 $ 0.02 6.42 $ 5.54 $ 0.01 5.55 $ 5.32 0.01 5.32 $ $ 5.50 $ 6.34 $ 0.02 6.36 $ 0.01 5.29 0.01 $ 5.51 $ 5.29 510.9 515.6 528.6 533.2 546.8 550.3 4.1 FINANCIAL STATEMENTS Table of Content Index to Financial Statements Consolidated Statements of Comprehensive Income 2019 3,281 $ 2018 2,937 $ 2017 2,914 $ (millions) Net earnings Other comprehensive (loss)/income, net of tax Pension and other benefit liabilities, net of tax Currency translation adjustment and cash flow hedges, net of tax Other comprehensive (Loss)/income Comprehensive income (65) 2 (63) 3,218 $ (52) (6) (58) 2,879 $ 2 6 8 2,922 $ See accompanying Notes to Consolidated Financial Statements. FINANCIAL STATEMENTS Consolidated Statements of Financial Position Table of Contents Index to Financial Statements February 1, February 2 (millions, except footnotes) 2020 2019 Assets Cash and cash equivalents 2,577 $ 1,556 Inventory 8,992 9,497 Other current assets 1,333 1,466 Total current assets 12,902 12,519 Property and equipment Land 6,036 6,064 Buildings and improvements 30,603 29,240 Fixtures and equipment 6,083 5,912 Computer hardware and software 2,692 2,544 Construction-in-progress 533 460 Accumulated depreciation (19,664) (18,687) Property and equipment, net 26,283 25,533 Operating lease assets 2,236 1,965 Other noncurrent assets 1,358 1,273 Total assets $ 42,779 $ 41,290 Liabilities and shareholders' investment Accounts payable $ 9,920 $ 9,761 Accrued and other current liabilities 4,406 4,201 Current portion of long-term debt and other borrowings 161 1,052 Total current liabilities 14,487 15,014 Long-term debt and other borrowings 11,338 10,223 Noncurrent operating lease liabilities 2,275 2,004 Deferred income taxes 1,122 972 Other noncurrent liabilities 1,724 1,780 Total noncurrent liabilities 16,459 14,979 Shareholders' investment Common stock 42 43 Additional paid-in capital 6,226 6,042 Retained earnings 6,433 6,017 Accumulated other comprehensive loss (868) (805) Total shareholders' investment 11,833 11,297 Total liabilities and shareholders' investment 42,779 $ 41,290 Common Stock Authorized 6,000,000,000 shares, $0.0833 par value; 504,198,962 shares issued and outstanding as of February 1, 2020; 517,761,600 shares issued and outstanding as of February 2, 2019. Preferred Stock Authorized 5,000,000 shares, $0.01 par value; no shares were issued or outstanding during any period presented. See accompanying Notes to Consolidated Financial Statements. FINANCIAL STATEMENTS Table of Contents Index to Financial Statements 2019 2018 2017 3.281 $ 12 3,269 2.937 5 7 2.930 2,914 6 2,908 2,604 147 178 10 29 2.474 132 322 2.476 112 (188) 123 208 95 505 18 140 199 (900) (299) 1,127 89 5,970 3 5,973 (348) (156) 1,307 419 6,861 74 6,935 7,099 18 7.117 Consolidated Statements of Cash Flows (millions) Operating activities Net earnings Earnings from discontinued operations, net of tax Net earnings from continuing operations Adjustments to reconcile net earnings to cash provided by operations: Depreciation and amortization Share-based compensation expense Deferred income taxes Loss on debt extinguishment Noncash losses/ (gains) and other, net Changes in operating accounts: Inventory Other assets Accounts payable Accrued and other liabilities Cash provided by operating activities-continuing operations Cash provided by operating activities discontinued operations Cash provided by operations Investing activities Expenditures for property and equipment Proceeds from disposal of property and equipment Cash paid for acquisitions, net of cash assumed Other investments Cash required for investing activities Financing activities Additions to long-term debt Reductions of long-term debt Dividends paid Repurchase of stock Stock option exercises Cash required for financing activities Net (decrease]/increase in cash and cash equivalents Cash and cash equivalents at beginning of period Cash and cash equivalents at end of period Supplemental information Interest paid, net of capitalized interest Income taxes paid Leased assets obtained in exchange for new finance lease liabilities Leased assets obtained in exchange for new operating lease liabilities (3.027) 63 (3,516) 85 (2,533) 31 (518) (55) (3,075) 20 (2.944) 15 (3.416) 1.739 (2.069) (1.330) (1,565) 73 (3,152) 1,021 1.556 2,577 $ (281) (1,335) (2,124) 96 (3,644) (1,087) 2.643 1.556 739 (2,192) (1,338) (1.046) 108 (3,729 131 2.512 2.643 $ $ 492 $ 696 379 464 476 S 373 130 246 678 934 139 212 See accompanying Notes to Consolidated Financial Statements. Consolidated Statements of Shareholders' Investment Common Stock Additional Accumulated Other Stock Par Paid-in Retained Comprehensive (millions) Shares Value Capital Earnings (Loss) / Income Total January 28, 2017 556.2 $ 46 $ 5,661 $ 5,846 $ (638) S 10,915 Net earnings 2,914 2,914 Other comprehensive income 8 8 Dividends declared (1,356) (1,356) Repurchase of stock (17.6) (1,026) (1,027) Stock options and awards 3.1 197 197 Reclassification of tax effects to retained earnings 117 (117) February 3, 2018 541.7 $ 45 $ 5,858 $ 6,495 $ (747) 11,651 Net earnings 2,937 2,937 Other comprehensive loss (58) (58) Dividends declared (1,347) (1,347) Repurchase of stock (272) (2) (2,068) (2,070) Stock options and awards 3.3 184 184 February 2, 2019 517.8 $ 43 S 6,042 $ 6,017 $ (805) $ 11,297 Net earnings 3,281 3,281 Other comprehensive loss (63) (63) Dividends declared (1,345) (1,345) Repurchase of stock (16.0) (1) (1,520) (1,521) Stock options and awards 184 184 February 1, 2020 504.2 $ 42 $ 6,226 $ 6,433 $ (868) S 11,833 We declared $2.62, $2.54, and $2.46 dividends per share for the twelve months ended February 1, 2020, February 2, 2019, and February 3, 2018, respectively. See accompanying Notes to Consolidated Financial Statements. 2.4 Table of Contents Item 6. Selected Consolidated Financial Data The selected consolidated financial data presented below should be read in conjunction with our consolidated financial statements and related notes included elsewhere in this document. 3.46 (Dollars in Millions, Except per Share and per Square Foot Data) 2019(e) 2018 2017(6) 2016 2015 Net sales Dollars $ $ 18,885 $ 19,167 $ 19.036 $ 18,636 $ 19.162 Net sales increase (decrease) (1.5)% 0.7% 2.1% (2.79% 0.9% Comparable sales (a) (1.3)% 1.7% 1.5% (2.4% 0.7% Per selling square foot (b) $ 229 is 231 $ 229 $ 224 $ 228 Total revenue $ 19,974 $ 20,229 $ 20.084 $ 19,681 $ 20.151 Gross margin as a percent of net sales 35.7% 36.4% 36.0% 35.9% 36.0% Selling, general, and administrative expenses ("SG&A") Dollars $ 5,705 $ 5,601 $ 5,501 $ 5,430 $ 5,399 As a percent of total revenue 28.6% 27.7% 27.4% 27.6% 26.8% Operating income Dollars Reported (GAAP) $ 1,099 $ 1,361 $ 1.416 $ 1,183 $ 1,553 Adjusted (non-GAAP) (c) $ 1,212 $ 1,465 $ 1,416 S 1,369 $ 1,553 As a percent of total revenue Reported (GAAP) 5.5% 6.7% 7.1% 6.0% 7.7% Adjusted (non-GAAP) (c) 6.1% 72% 7.1% 7.0% 7.7% Net income Reported (GAAP) $ 691 s 801 $ 859 $ 556 $ 673 Adjusted (non-GAAP) (c) $ 769 $ 927 $ 703 $ 673 $ 781 Diluted earnings per share Reported (GAAP) $ 4.37 $ 4.84S 5.12$ 3.11 $ Adjusted (non-GAAP) (c) $ 4.86 s 5.60 $ 4.19 $ 3.76 S 4.01 Dividends per share $ 2.68 $ 2.44 $ 220 S 2.00 S 1.80 Balance sheet Total assets $ 14,555 $ 12.469 $ 13,389 $ 13,623 $ 13,660 Working capital $ 1,880 s 2.105 $ 2,671 $ 2.264 $ 2,352 Long-term debt $ 1,856 s 1.861 $ 2,797 S 2.795 $ 2,792 Finance lease and financing obligations $ 1,491 s 1.638 $ 1,717 S 1.816 $ 1,916 Operating lease liabilities $ 2,777 s $ $ s Shareholders' equity $ 5,450 $ 5,527 $ 5,419 $5,170 $ 5,484 Cash flow Net cash provided by operating activities $ 1,657 $ 2,107 $ 1,691 $ 2.153 $ 1,484 Capital expenditures $ 855 $ 578 $ 672 $ 768 $ 690 Free cash flow (d) $ 700 $ 1,403 $ 881 $ 1,269 $ 681 Kohl's store information Number of stores 1,159 1.159 1,158 1.154 1,164 Total square feet of selling space in thousands) 82,192 82,620 82,804 82.757 83.810 (a Kohl's store sales are included in comparable sales after the store has been open for 12 full months. Digital sales and sales at remodeled and relocated Kohl's stores are included in comparable sales, unless square footage has changed by more than 10% 2019 compares the 52 weeks ended February 1, 2020 and February 2, 2019. 2018 compares the 52 weeks ended February 2, 2019 and February 3, 2018 (b) Net sales per selling square foot includes in-store and digital merchandise sales. (c) Pre-tax adjustments include impairments, store dosing and other costs of $113 million in 2019, $104 million in 2018, and $186 million in 2016: gain on extinguishment of debt of $9 million in 2019 and debt extinguishment losses of $63 million in 2018 and $169 million in 2015, and tax settlement and reform benefits of $156 million in 2017. See GAAP to non-GAAP reconciliation in Results of Operations. id) Free cash flow is a non-GAAP financial measure that we define as net cash provided by operating activities and proceeds from financing obligations less capital expenditures and capital lease and financing obligation payments. See GAAP to non-GAAP reconciliation in Liquidity and Capital Resources. le) Includes adoption of ASC 842 Leases ('new lease accounting standard"). See Note 3 of the Consolidated Financial Statements () Fiscal 2017 was a 53-week year. The impact of the 534 week is approximated as follows net sales were $170 million, other revenues were $10 million: SG&A was $40 million interest was $3 million, net income was $15 million, and diluted earnings per share were approximately $0.10. 18 Table of Contents Key Financial Ratio Calculations The following table includes our ROI calculation. All ratios are non-GAAP financial measures: (Dollars in Millions) 2019 2018 2017 Operating income $ 1,099 $ 1,361 $ 1.416 Depreciation and amortization 917 964 991 Rent expense 314 301 293 EBITDAR 2,330 2,626 2,700 Impairments, store closing and other costs 113 104 Adjusted EBITDAR 2,443 $ 2,730 $ 2,700 Average: (a) Total assets 14,802 $ 13,161 $ 13,467 Cash equivalents and long-term investments (b) (393) (753) (629) Other assets (31) (33) (32) Accumulated depreciation and amortization 6,854 7,812 7,217 Accounts payable (1,495) (1,580) (1.548) Accrued liabilities (1,264) (1,235) (1.213) Other long-term liabilities (231) (658) (674) Capitalized rent (c) 2,831 2.767 Gross investment (AGI") 18,242 $ 19,545 $ 19,355 ROI (d) 12.8% 13.4% 14.0% Adjusted ROI (d) 13.4% 14.0% 14.0% (a) Represents average of five most recent quarter-end balances. For 2019. fourth quarter 2018 balances were adjusted to reflect the impact of the new lease accounting standard (b) Represents excess cash not required for operations. (c) Represents ten times store rent and five times equipment other rent. This is not applicable in 2019 as operating feases are now recorded on the balance sheet due to the adoption of the new lease accounting standard. (d) EBITDAR or adjusted EBITDAR, as applicable, divided by gross investment 2018 2019 1,491 $ 1,856 3,347 $ 2,777 1,638 1,861 3,499 The following table includes our adjusted debt to adjusted EBITDAR calculation: (Dollars in Millions) Finance lease and financing obligations Long-term debt Total debt $ Operating leases Rent x 8 Adjusted debt Operating income $ Depreciation and amortization Rent expense EBITDAR Impairments, store closing and other costs Adjusted EBITDAR Adjusted debt to adjusted EBITDAR 6,124 $ 1,099 $ 917 314 2,330 113 2,443 $ 2.51 2.408 5.907 1,361 964 301 2,626 104 2.730 2.16 Table of Contents 2019 $ 3,358 (2) 3,356 2,777 6,133 $ $ The following table includes our debt ratio calculation, as defined by our debt agreements: (Dollars in Millions) Included Indebtedness Consolidated indebtedness Permitted exclusions for LIC obligations Permitted exclusions for unamortized debt discount Subtotal Capitalized amount of operating leases Included indebtedness Debt Compliance EBITDAR Net income Impairments, store closing and other costs Interest charges Income taxes (foreign and domestic) Depreciation and amortization Other non-cash expenses reducing net income Subtotal Non-cash items increasing net income Gains on extinguishment of debt Capital gains from the disposition of fixed assets Subtotal Consolidated lease expense Consolidated EBITDAR Debt ratio (a) Maximum permitted debt ratio (a) Included indebtedness divided by Consolidated EBITDAR 691 113 207 210 917 67 2,205 (6) (9) (2) 2,188 314 2,502 2.45 3.75 Contractual Obligations Our contractual obligations as of February 1, 2020 were as follows: $ 317 Maturing in: 2021 2023 2025 and and and (Dollars in Millions) Total 2020 2022 2024 after Recorded contractual obligations: Outstanding long-term debt $ 1,867 S $ $ 534 $ 1,333 Finance lease and financing obligations 1,266 117 205 148 796 Operating leases (a) 2.777 152 272 2,036 Other (b) 11 7 5,921 276 526 954 4,165 Unrecorded contractual obligations: Interest payments: Long-term debt 1,079 90 179 153 657 Finance lease and financing obligations 1.737 133 241 212 1,151 Operating leases (a) 2,063 151 277 245 1,390 Other (b) 817 306 332 146 33 5,696 680 1,029 756 3,231 Total 11,617 S 956 $ 1,555 $ 1.710 $ 7,396 (a) Our leases typically require that we pay taxes, insurance and maintenance costs in addition to the minimum rental payments included in the table above. Such Financial Summary 706 2017 2016 2015 2019 2018 As Adusted As dit FINANCIAL RESULTS in millions Sales $ 77130 S 74433 $ 74786 $ 89,414 $ 73.717 Other revenue 982 23 928 857 777 Total revenue 78312 75356 72714 70.271 74494 Cost of Sales 54864 53.299 51125 49345 52241 Selling, general and administrative expenses (SGBA) 16.233 15723 15340 1217 15,406 Depreciation and amortization exclusive of depreciation included in cost of sales) 2.357 2.224 2225 2045 1960 Operating income 4658 4110 4,224 4864 4878 Not interest expen 461 653 991 BOZ Net other income /expense ) 19 (27) (59) (88) 1662 Earnings from continuing operations before income taxes 3,575 3630 3.961 2008 4 Provision for income taxes 722 1,225 1002 Net earnings from continuing operations 3.269 2930 2.908 2666 3321 Discontinued operations, net of tax 12 7 6 68 42 Net earnings $ 3,281 S 2,937 $ 2914 $ 2734 $ 3.363 PER SHARE Basic earnings per share Continuing operations $ 6.39 $ 554 $ 522 $ 461 $ 529 Discontinued operations 002 0.01 po 001 012 OOT Net carrings per share $ 642 $ 5.55 $ 532 $ $ 535 Diluted earnings per share Continuing operations $ 6.34 $ 5.50 $ 529 $ 458 $ 5.25 Discontinued operations 002 001 001 012 007 Net earnings per share $ 6.36 551 $ 529 $ 480 531 Cash dividends declared $ 262 $ 254 $ 246 $ 2.36 $ 220 FINANCIAL POSITION in millions) Total assets $ can 42,779 $ 1200 $40.303 $ 38,721 $40.262 Capital expenditures $ 3027 $ 3546 $ 2583 $ 1547 $ 1438 Long-term debt, including current portion $ 1499 $ 11275 $ 11398 $ 12.591 $ 1270 Not debt $ 9689 $ 10,506 S 0.267 $ 11481 Shareholders investment $ 11833 $ 11297 $ 11651 $ 10,915 $12.957 FINANCIAL RATIOS Comparable sales growth 34% 50% 139 10.5% 21% Gross margin 1% of sales 28.9% 284% 28.8 29.2% 291% SGBA expenses (% of total revenue) 20.8% 209% 20.8% 20.2% 207% Operating income margin % of total revenuel 60% 5.5 589 6.9% 6.5% OTHER Common shares outstanding in milions 5042 578 5617 5562 8022 Operating cash flow provided by continuing operations in millions) 7099 3 5.970 $ 6861 $ 5337 Rovern per square foot $ 326 $ 314 $ 298 $ 293 $ 310 Retail square foot in thousands) 240.596 239,581 232356 220.502 2293 Square footage growth 04% 099 102% Total number of stores 1868 1844 1822 18 1732 Total number of distribution centers 42 40 41 40 A Cand of 53 weeks The francia summary data for fiscal year 2015 does not meet adoption of Accounting Standards Update US No 2016-03-31 The 2013 se dodir is proud to the December 2015 se of sur sharmacy and cric business Parmacy Transaction CVS Pharmacy, Inc. 206 si dudes $35 milion related to our former pharmacy and clinic bune daudessa on sarly retireret af det of $10 miliona mion, and 22 milion for 2018 2017 and 20th For 2014 includes the gain on the sale of our pharmacy and for 20 and 20% includes 6 milion and 33 minspective of doc tax bereits and to the Tax Cuts and Jobs Act of 2017 al housing and portion of long-term and other borrowingsnet of short-terment of Orion, 1 milion 131 milion milion and $300 milion in 2012, 2011, 2012 2011 and 20 spec Moragon ball this mature is an indicator of our vel francia bude short motsar www to paydot matunity bigations For 2017 and saler, only short hold by US cities were used to count det because oursed by its based outside the US were restricted for Dal See detition of comparable sn Form Doktor Management Discum and Aros otroncal Condition and Results of Operations @Regree per foot which is calculated using ring for more square out in 2017, per un todoxuding the 53rd order provide a more comparson to the years. Using total reported for 2017 including the world never person foot of $300 The 2018 decrease pray due to the Pharmacy Transaction. Our or pharmacy and intunes contributed approximately 16 to 2015 por groot FINANCIAL STATEMENTS Table of Content Consolidated Statements of Operations $ 2019 77,130 $ 982 923 2018 2017 74,433 $ 71,786 928 75,356 72,714 53,299 51,125 15,723 15,140 78,112 54,864 16,233 2,357 4,658 477 (millions, except per share data) Sales Other revenue Total revenue Cost of sales Selling, general and administrative expenses Depreciation and amortization (exclusive of depreciation included in cost of sales) Operating income Net interest expense Net other (income) / expense Earnings from continuing operations before income taxes Provision for income taxes Net earnings from continuing operations Discontinued operations, net of tax Net earnings Basic earnings per share Continuing operations Discontinued operations Net earnings per share Diluted earnings per share Continuing operations Discontinued operations Net earnings per share Weighted average common shares outstanding Basic Diluted Antidilutive shares Note: Per share amounts may not foot due to rounding. See accompanying Notes to Consolidated Financial Statements. 4,190 921 3,269 12 3,281 $ 2,224 4,110 461 (27) 3,676 746 2,930 7 2,937 $ 2,225 4,224 653 (59) 3,630 722 2,908 6 2,914 $ 6.39 $ 0.02 6.42 $ 5.54 $ 0.01 5.55 $ 5.32 0.01 5.32 $ $ 5.50 $ 6.34 $ 0.02 6.36 $ 0.01 5.29 0.01 $ 5.51 $ 5.29 510.9 515.6 528.6 533.2 546.8 550.3 4.1 FINANCIAL STATEMENTS Table of Content Index to Financial Statements Consolidated Statements of Comprehensive Income 2019 3,281 $ 2018 2,937 $ 2017 2,914 $ (millions) Net earnings Other comprehensive (loss)/income, net of tax Pension and other benefit liabilities, net of tax Currency translation adjustment and cash flow hedges, net of tax Other comprehensive (Loss)/income Comprehensive income (65) 2 (63) 3,218 $ (52) (6) (58) 2,879 $ 2 6 8 2,922 $ See accompanying Notes to Consolidated Financial Statements. FINANCIAL STATEMENTS Consolidated Statements of Financial Position Table of Contents Index to Financial Statements February 1, February 2 (millions, except footnotes) 2020 2019 Assets Cash and cash equivalents 2,577 $ 1,556 Inventory 8,992 9,497 Other current assets 1,333 1,466 Total current assets 12,902 12,519 Property and equipment Land 6,036 6,064 Buildings and improvements 30,603 29,240 Fixtures and equipment 6,083 5,912 Computer hardware and software 2,692 2,544 Construction-in-progress 533 460 Accumulated depreciation (19,664) (18,687) Property and equipment, net 26,283 25,533 Operating lease assets 2,236 1,965 Other noncurrent assets 1,358 1,273 Total assets $ 42,779 $ 41,290 Liabilities and shareholders' investment Accounts payable $ 9,920 $ 9,761 Accrued and other current liabilities 4,406 4,201 Current portion of long-term debt and other borrowings 161 1,052 Total current liabilities 14,487 15,014 Long-term debt and other borrowings 11,338 10,223 Noncurrent operating lease liabilities 2,275 2,004 Deferred income taxes 1,122 972 Other noncurrent liabilities 1,724 1,780 Total noncurrent liabilities 16,459 14,979 Shareholders' investment Common stock 42 43 Additional paid-in capital 6,226 6,042 Retained earnings 6,433 6,017 Accumulated other comprehensive loss (868) (805) Total shareholders' investment 11,833 11,297 Total liabilities and shareholders' investment 42,779 $ 41,290 Common Stock Authorized 6,000,000,000 shares, $0.0833 par value; 504,198,962 shares issued and outstanding as of February 1, 2020; 517,761,600 shares issued and outstanding as of February 2, 2019. Preferred Stock Authorized 5,000,000 shares, $0.01 par value; no shares were issued or outstanding during any period presented. See accompanying Notes to Consolidated Financial Statements. FINANCIAL STATEMENTS Table of Contents Index to Financial Statements 2019 2018 2017 3.281 $ 12 3,269 2.937 5 7 2.930 2,914 6 2,908 2,604 147 178 10 29 2.474 132 322 2.476 112 (188) 123 208 95 505 18 140 199 (900) (299) 1,127 89 5,970 3 5,973 (348) (156) 1,307 419 6,861 74 6,935 7,099 18 7.117 Consolidated Statements of Cash Flows (millions) Operating activities Net earnings Earnings from discontinued operations, net of tax Net earnings from continuing operations Adjustments to reconcile net earnings to cash provided by operations: Depreciation and amortization Share-based compensation expense Deferred income taxes Loss on debt extinguishment Noncash losses/ (gains) and other, net Changes in operating accounts: Inventory Other assets Accounts payable Accrued and other liabilities Cash provided by operating activities-continuing operations Cash provided by operating activities discontinued operations Cash provided by operations Investing activities Expenditures for property and equipment Proceeds from disposal of property and equipment Cash paid for acquisitions, net of cash assumed Other investments Cash required for investing activities Financing activities Additions to long-term debt Reductions of long-term debt Dividends paid Repurchase of stock Stock option exercises Cash required for financing activities Net (decrease]/increase in cash and cash equivalents Cash and cash equivalents at beginning of period Cash and cash equivalents at end of period Supplemental information Interest paid, net of capitalized interest Income taxes paid Leased assets obtained in exchange for new finance lease liabilities Leased assets obtained in exchange for new operating lease liabilities (3.027) 63 (3,516) 85 (2,533) 31 (518) (55) (3,075) 20 (2.944) 15 (3.416) 1.739 (2.069) (1.330) (1,565) 73 (3,152) 1,021 1.556 2,577 $ (281) (1,335) (2,124) 96 (3,644) (1,087) 2.643 1.556 739 (2,192) (1,338) (1.046) 108 (3,729 131 2.512 2.643 $ $ 492 $ 696 379 464 476 S 373 130 246 678 934 139 212 See accompanying Notes to Consolidated Financial Statements. Consolidated Statements of Shareholders' Investment Common Stock Additional Accumulated Other Stock Par Paid-in Retained Comprehensive (millions) Shares Value Capital Earnings (Loss) / Income Total January 28, 2017 556.2 $ 46 $ 5,661 $ 5,846 $ (638) S 10,915 Net earnings 2,914 2,914 Other comprehensive income 8 8 Dividends declared (1,356) (1,356) Repurchase of stock (17.6) (1,026) (1,027) Stock options and awards 3.1 197 197 Reclassification of tax effects to retained earnings 117 (117) February 3, 2018 541.7 $ 45 $ 5,858 $ 6,495 $ (747) 11,651 Net earnings 2,937 2,937 Other comprehensive loss (58) (58) Dividends declared (1,347) (1,347) Repurchase of stock (272) (2) (2,068) (2,070) Stock options and awards 3.3 184 184 February 2, 2019 517.8 $ 43 S 6,042 $ 6,017 $ (805) $ 11,297 Net earnings 3,281 3,281 Other comprehensive loss (63) (63) Dividends declared (1,345) (1,345) Repurchase of stock (16.0) (1) (1,520) (1,521) Stock options and awards 184 184 February 1, 2020 504.2 $ 42 $ 6,226 $ 6,433 $ (868) S 11,833 We declared $2.62, $2.54, and $2.46 dividends per share for the twelve months ended February 1, 2020, February 2, 2019, and February 3, 2018, respectively. See accompanying Notes to Consolidated Financial Statements. 2.4 Table of Contents Item 6. Selected Consolidated Financial Data The selected consolidated financial data presented below should be read in conjunction with our consolidated financial statements and related notes included elsewhere in this document. 3.46 (Dollars in Millions, Except per Share and per Square Foot Data) 2019(e) 2018 2017(6) 2016 2015 Net sales Dollars $ $ 18,885 $ 19,167 $ 19.036 $ 18,636 $ 19.162 Net sales increase (decrease) (1.5)% 0.7% 2.1% (2.79% 0.9% Comparable sales (a) (1.3)% 1.7% 1.5% (2.4% 0.7% Per selling square foot (b) $ 229 is 231 $ 229 $ 224 $ 228 Total revenue $ 19,974 $ 20,229 $ 20.084 $ 19,681 $ 20.151 Gross margin as a percent of net sales 35.7% 36.4% 36.0% 35.9% 36.0% Selling, general, and administrative expenses ("SG&A") Dollars $ 5,705 $ 5,601 $ 5,501 $ 5,430 $ 5,399 As a percent of total revenue 28.6% 27.7% 27.4% 27.6% 26.8% Operating income Dollars Reported (GAAP) $ 1,099 $ 1,361 $ 1.416 $ 1,183 $ 1,553 Adjusted (non-GAAP) (c) $ 1,212 $ 1,465 $ 1,416 S 1,369 $ 1,553 As a percent of total revenue Reported (GAAP) 5.5% 6.7% 7.1% 6.0% 7.7% Adjusted (non-GAAP) (c) 6.1% 72% 7.1% 7.0% 7.7% Net income Reported (GAAP) $ 691 s 801 $ 859 $ 556 $ 673 Adjusted (non-GAAP) (c) $ 769 $ 927 $ 703 $ 673 $ 781 Diluted earnings per share Reported (GAAP) $ 4.37 $ 4.84S 5.12$ 3.11 $ Adjusted (non-GAAP) (c) $ 4.86 s 5.60 $ 4.19 $ 3.76 S 4.01 Dividends per share $ 2.68 $ 2.44 $ 220 S 2.00 S 1.80 Balance sheet Total assets $ 14,555 $ 12.469 $ 13,389 $ 13,623 $ 13,660 Working capital $ 1,880 s 2.105 $ 2,671 $ 2.264 $ 2,352 Long-term debt $ 1,856 s 1.861 $ 2,797 S 2.795 $ 2,792 Finance lease and financing obligations $ 1,491 s 1.638 $ 1,717 S 1.816 $ 1,916 Operating lease liabilities $ 2,777 s $ $ s Shareholders' equity $ 5,450 $ 5,527 $ 5,419 $5,170 $ 5,484 Cash flow Net cash provided by operating activities $ 1,657 $ 2,107 $ 1,691 $ 2.153 $ 1,484 Capital expenditures $ 855 $ 578 $ 672 $ 768 $ 690 Free cash flow (d) $ 700 $ 1,403 $ 881 $ 1,269 $ 681 Kohl's store information Number of stores 1,159 1.159 1,158 1.154 1,164 Total square feet of selling space in thousands) 82,192 82,620 82,804 82.757 83.810 (a Kohl's store sales are included in comparable sales after the store has been open for 12 full months. Digital sales and sales at remodeled and relocated Kohl's stores are included in comparable sales, unless square footage has changed by more than 10% 2019 compares the 52 weeks ended February 1, 2020 and February 2, 2019. 2018 compares the 52 weeks ended February 2, 2019 and February 3, 2018 (b) Net sales per selling square foot includes in-store and digital merchandise sales. (c) Pre-tax adjustments include impairments, store dosing and other costs of $113 million in 2019, $104 million in 2018, and $186 million in 2016: gain on extinguishment of debt of $9 million in 2019 and debt extinguishment losses of $63 million in 2018 and $169 million in 2015, and tax settlement and reform benefits of $156 million in 2017. See GAAP to non-GAAP reconciliation in Results of Operations. id) Free cash flow is a non-GAAP financial measure that we define as net cash provided by operating activities and proceeds from financing obligations less capital expenditures and capital lease and financing obligation payments. See GAAP to non-GAAP reconciliation in Liquidity and Capital Resources. le) Includes adoption of ASC 842 Leases ('new lease accounting standard"). See Note 3 of the Consolidated Financial Statements () Fiscal 2017 was a 53-week year. The impact of the 534 week is approximated as follows net sales were $170 million, other revenues were $10 million: SG&A was $40 million interest was $3 million, net income was $15 million, and diluted earnings per share were approximately $0.10. 18 Table of Contents Key Financial Ratio Calculations The following table includes our ROI calculation. All ratios are non-GAAP financial measures: (Dollars in Millions) 2019 2018 2017 Operating income $ 1,099 $ 1,361 $ 1.416 Depreciation and amortization 917 964 991 Rent expense 314 301 293 EBITDAR 2,330 2,626 2,700 Impairments, store closing and other costs 113 104 Adjusted EBITDAR 2,443 $ 2,730 $ 2,700 Average: (a) Total assets 14,802 $ 13,161 $ 13,467 Cash equivalents and long-term investments (b) (393) (753) (629) Other assets (31) (33) (32) Accumulated depreciation and amortization 6,854 7,812 7,217 Accounts payable (1,495) (1,580) (1.548) Accrued liabilities (1,264) (1,235) (1.213) Other long-term liabilities (231) (658) (674) Capitalized rent (c) 2,831 2.767 Gross investment (AGI") 18,242 $ 19,545 $ 19,355 ROI (d) 12.8% 13.4% 14.0% Adjusted ROI (d) 13.4% 14.0% 14.0% (a) Represents average of five most recent quarter-end balances. For 2019. fourth quarter 2018 balances were adjusted to reflect the impact of the new lease accounting standard (b) Represents excess cash not required for operations. (c) Represents ten times store rent and five times equipment other rent. This is not applicable in 2019 as operating feases are now recorded on the balance sheet due to the adoption of the new lease accounting standard. (d) EBITDAR or adjusted EBITDAR, as applicable, divided by gross investment 2018 2019 1,491 $ 1,856 3,347 $ 2,777 1,638 1,861 3,499 The following table includes our adjusted debt to adjusted EBITDAR calculation: (Dollars in Millions) Finance lease and financing obligations Long-term debt Total debt $ Operating leases Rent x 8 Adjusted debt Operating income $ Depreciation and amortization Rent expense EBITDAR Impairments, store closing and other costs Adjusted EBITDAR Adjusted debt to adjusted EBITDAR 6,124 $ 1,099 $ 917 314 2,330 113 2,443 $ 2.51 2.408 5.907 1,361 964 301 2,626 104 2.730 2.16 Table of Contents 2019 $ 3,358 (2) 3,356 2,777 6,133 $ $ The following table includes our debt ratio calculation, as defined by our debt agreements: (Dollars in Millions) Included Indebtedness Consolidated indebtedness Permitted exclusions for LIC obligations Permitted exclusions for unamortized debt discount Subtotal Capitalized amount of operating leases Included indebtedness Debt Compliance EBITDAR Net income Impairments, store closing and other costs Interest charges Income taxes (foreign and domestic) Depreciation and amortization Other non-cash expenses reducing net income Subtotal Non-cash items increasing net income Gains on extinguishment of debt Capital gains from the disposition of fixed assets Subtotal Consolidated lease expense Consolidated EBITDAR Debt ratio (a) Maximum permitted debt ratio (a) Included indebtedness divided by Consolidated EBITDAR 691 113 207 210 917 67 2,205 (6) (9) (2) 2,188 314 2,502 2.45 3.75 Contractual Obligations Our contractual obligations as of February 1, 2020 were as follows: $ 317 Maturing in: 2021 2023 2025 and and and (Dollars in Millions) Total 2020 2022 2024 after Recorded contractual obligations: Outstanding long-term debt $ 1,867 S $ $ 534 $ 1,333 Finance lease and financing obligations 1,266 117 205 148 796 Operating leases (a) 2.777 152 272 2,036 Other (b) 11 7 5,921 276 526 954 4,165 Unrecorded contractual obligations: Interest payments: Long-term debt 1,079 90 179 153 657 Finance lease and financing obligations 1.737 133 241 212 1,151 Operating leases (a) 2,063 151 277 245 1,390 Other (b) 817 306 332 146 33 5,696 680 1,029 756 3,231 Total 11,617 S 956 $ 1,555 $ 1.710 $ 7,396 (a) Our leases typically require that we pay taxes, insurance and maintenance costs in addition to the minimum rental payments included in the table above. Such
Step by Step Solution
There are 3 Steps involved in it

Get step-by-step solutions from verified subject matter experts