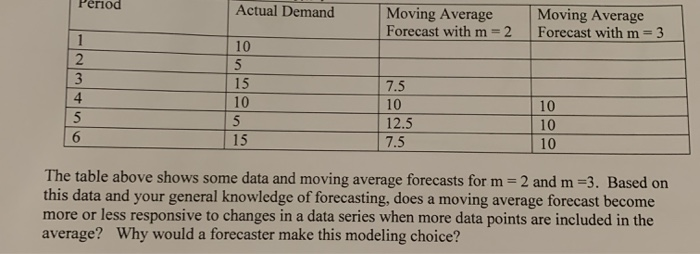
Question: reriod Actual Demand Moving Average Forecast with m=2 Moving Average Forecast with m=3 10 5 15 75 10 10 5 15 12.5 7.5 6 The

reriod Actual Demand Moving Average Forecast with
reriod Actual Demand Moving Average Forecast with m=2 Moving Average Forecast with m=3 10 5 15 75 10 10 5 15 12.5 7.5 6 The table above shows some data and moving average forecasts for m= 2 and m =3. Based on this data and your general knowledge of forecasting, does a moving average forecast become more or less responsive to changes in a data series when more data points are included in the average? Why would a forecaster make this modeling choice

Step by Step Solution

There are 3 Steps involved in it

1 Expert Approved Answer
Step: 1 Unlock blur-text-image
Question Has Been Solved by an Expert!

Get step-by-step solutions from verified subject matter experts

Step: 2 Unlock
Step: 3 Unlock

Students Have Also Explored These Related General Management Questions!