Question: Research & Development DRAFT SAVED AT Dec 05.2020 23SAM CST Decisions Name Perceptual map (at end of the New Pfmn New Size MTBF Revision Date
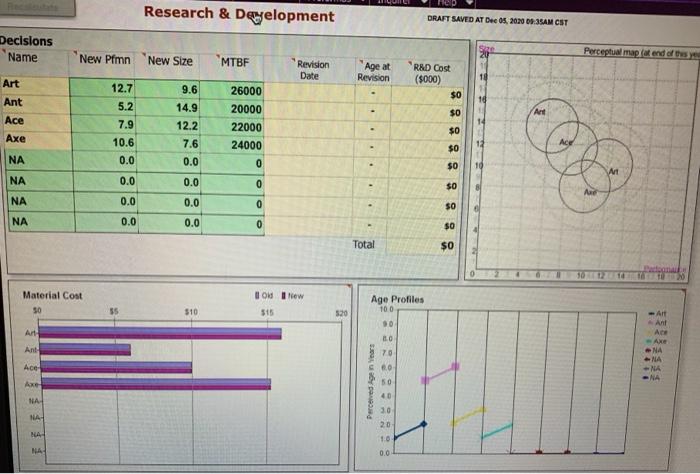
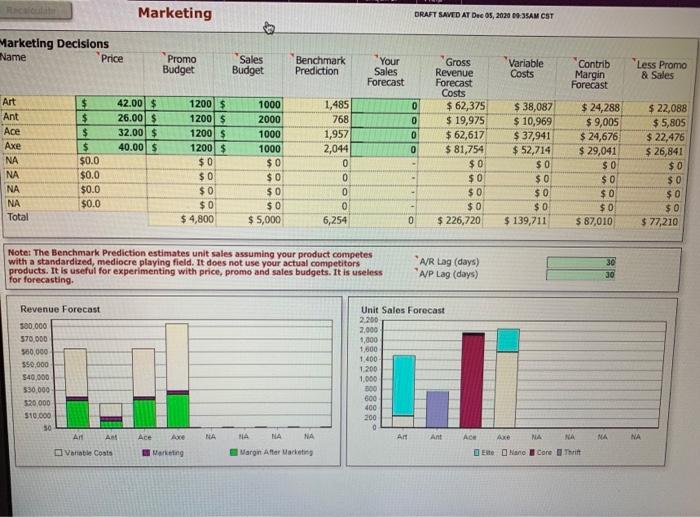
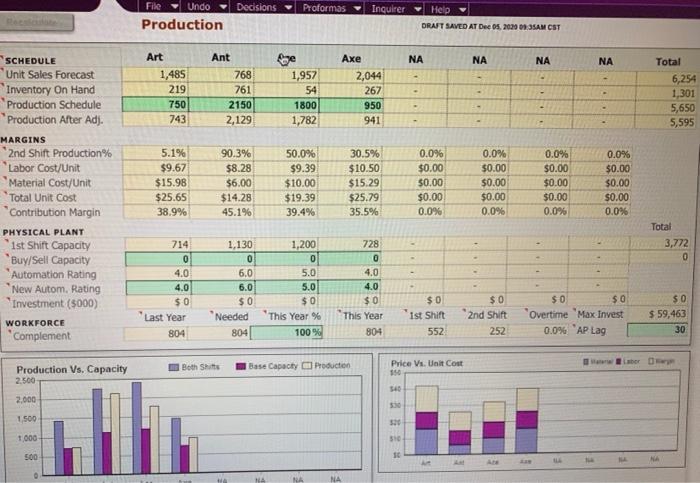
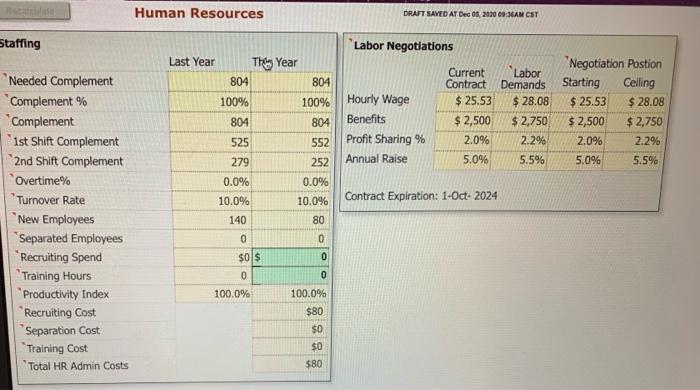
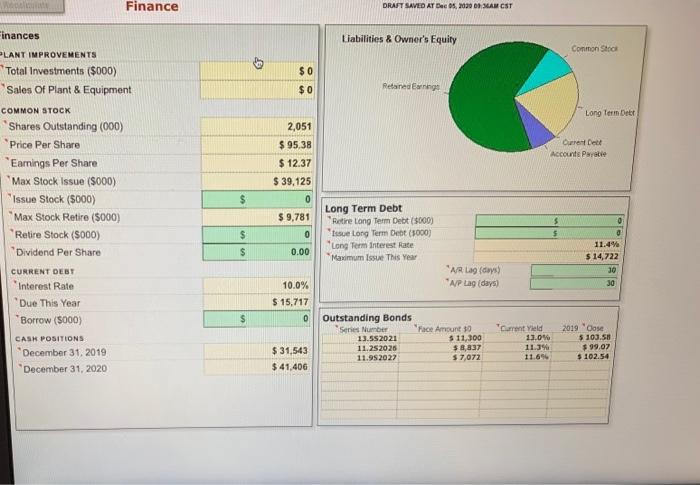
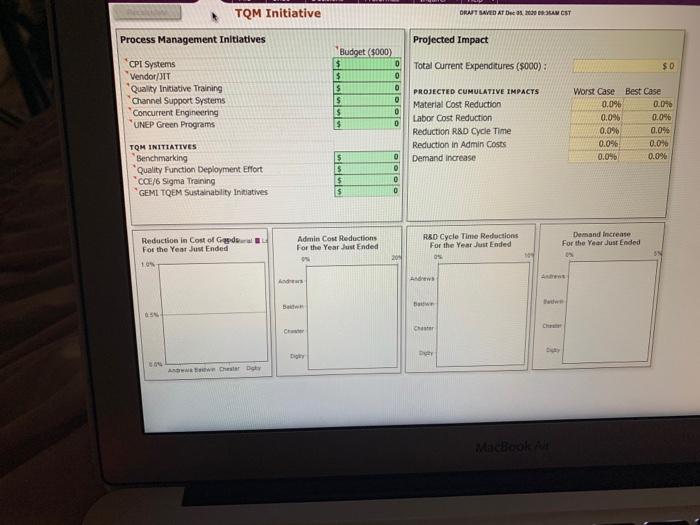
Research & Development DRAFT SAVED AT Dec 05.2020 23SAM CST Decisions Name Perceptual map (at end of the New Pfmn New Size MTBF Revision Date R&D Cost Age at Revision Art ($000) 9.6 10 Art Ant Ace Axe 12.7 5.2 7.9 10.6 0.0 26000 20000 22000 24000 14.9 12.2 7.6 0.0 14 88888 Acg NA 0 10 WI NA 0.0 0.0 0 $0 NA 0.0 0.0 0 $0 NA 0.0 0.0 0 SO Total $0 Material Cost ON New Age Profiles 100 35 510 $15 520 90 AH Art Ant Ace - AXE NA Ant LO 70 Ace 00 NA Axe Perceived gears 50 40 NA NA 20 MA 10 NA 0.0 Marketing DRAFT SAVED AT Due 05, 2020 09:35AM CST Marketing Decisions Name Price Promo Budget Sales Budget Benchmark Prediction * Your Sales Forecast Variable Costs Contrib Margin Forecast Less Promo & Sales 42.00 $ 26.00 $ 32.00 $ 40.00 $ Art Ant Ace Axe NA NA NA NA Total $ $ $ $ $0.0 $0.0 $0.0 $0.0 1200$ 1200 $ 1200 $ 1200 $ $0 $0 $0 $0 $ 4,800 1000 2000 1000 1000 $0 $0 1,485 768 1,957 2,044 0 0 0 0 6,254 OOOOO Gross Revenue Forecast Costs $ 62,375 $ 19,975 $ 62,617 $ 81,754 $0 $0 $0 $0 $ 226,720 $ 38,087 $ 10,969 $ 37,941 $ 52,714 SO $0 $0 $0 $ 139,711 $ 24,288 $ 9,005 $ 24,676 $ 29,041 $0 $0 $0 $0 $ 87,010 $ 22,088 $ 5,805 $ 22,476 $ 26,841 $0 $0 $0 $0 $ 77,210 $0 $0 $5,000 Note: The Benchmark Prediction estimates unit sales assuming your product competes with a standardized, mediocre playing field. It does not use your actual competitors products. It is useful for experimenting with price, promo and sales budgets. It is useless for forecasting A/R Lag (days) A/P Lag (days) 30 30 Revenue Forecast 500.000 570,000 550.000 $50,000 $40,000 $30.000 520000 $10.000 50 A Unit Sales Forecast 2.200 7.000 1,000 1,500 1.400 1.200 1.000 300 600 400 200 0 L. Ace NA NA NA Axe NA NA NA Variable Coats Marketing Margin After acting Ee Nane Core Thrift Decisions Proformas Inquirer Help Filc Undo Production DRAIT SAVED AT Dec 05. 20:00 AM CST Art Axe NA NA NA NA - 1,485 219 750 743 Ant 768 761 2150 2,129 Age 1,957 54 1800 1,782 2,044 267 950 941 ... Total 6,254 1,301 5,650 5,595 SCHEDULE Unit Sales Forecast Inventory On Hand Production Schedule Production After Adj. MARGINS *2nd Shift Production% Labor Cost/Unit Material Cost/Unit Total Unit Cost Contribution Margin PHYSICAL PLANT 1st Shift Capacity Buy/Sell Capacity Automation Rating New Autom. Rating Investment (5000) WORKFORCE Complement 5.1% $9.67 $15.98 $25.65 38.9% 90.3% $8.28 $6.00 $14.28 45.1% 50.0% $9.39 $10.00 $19.39 39.4% 30.5% $10.50 $15.29 $25.79 35.5% 0.0% $0.00 $0.00 $0.00 0.0% 0.0% $0.00 $0.00 $0.00 0.0% 0.0% $0.00 $0.00 $0.00 0.0% 0.0% $0.00 $0.00 $0.00 0.0% Total 3,772 0 714 0 4.0 4.0 $0 Last Year 804 1,130 0 6.0 6.0 $0 Needed 804 1,200 0 5.0 5.0 $0 This Year % 100% 728 0 4.0 4.0 $0 This Year 804 $0 ist Shift 552 $0 2nd Shift 252 $0 $0 Overtime 'Max Invest 0.0% AP Lag $0 $ 59,463 30 B Both Shits Base Capacty Production Production Vs. Capacity 2.500 Price Vs. Unit Cost 150 540 2.000 1,500 536 1.000 500 10 NA Human Resources DRAPT SAVED AT Dec 08, 20:20 00:36AM CST Staffing Labor Negotiations Last Year This Year 804 804 100% 100% 804 "Labor Negotiation Postion Demands Starting Celling $28.08 $ 25.53 $ 28.08 $2,750 $ 2,500 $2,750 2.2% 2.0% 2.2% 5.5% 5.0% 5.5% Hourly Wage Benefits Profit Sharing % Annual Raise 804 Current Contract $ 25.53 $ 2,500 2.0% 5.0% 525 552 279 252 0.0% 0.0% 10.0% Contract Expiration: 1-Oct-2024 Needed Complement Complement % *Complement '1st Shift Complement 2nd Shift Complement Overtime% "Turnover Rate "New Employees 'Separated Employees Recruiting Spend Training Hours Productivity Index Recruiting Cost Separation Cost Training Cost Total HR Admin Costs 140 0 10.0% 80 0 $0 $ 0 0 100.0% 0 100.0% $80 $0 $0 $80 Finance DRAFT SAVED AT Dec 05, 2030AM CST Liabilities & Owner's Equity Common Stock $0 $0 Retained wings Long Terms 2,051 $ 95.38 $ 12.37 Ourent Dell Accounts Payable $ 39,125 inances LANT IMPROVEMENTS *Total Investments ($000) Sales Of Plant & Equipment COMMON STOCK Shares Outstanding (000) Price Per Share Eamnings Per Share "Max Stock Issue (5000) Issue Stock (5000) *Max Stock Retire (5000) "Retire Stock (5000) "Dividend Per Share CURRENT DEBT Interest Rate Due. This Year Borrow (5000) CASH POSITIONS December 31, 2019 December 31, 2020 $ 0 $ 9,781 0 Long Term Debt Retire Long Term Debt (5000) fase Long Term Debt (5000) Long Term Interest Rate "Maximum Issue This Year . $ $ $ 0.00 11.4% $ 14,722 30 A Lag (days) "A/P Lag (days) JO 10.0% $ 15,717 0 Outstanding Bonds Sene Number "Face Amount 50 13.552021 5 11,300 11.25 2026 $ 3,837 11.952022 $7,072 Current Yield 13.04 11.3 11.696 2019 Con 5 103.58 $99.07 $ 102.54 $ 31,543 $41,406 TQM Initiative DRAIT SAVED AT DE 20 SAM CST Process Management Initiatives Projected Impact Total Current Expenditures (5000): $0 CPI Systems Vendor/JIT Quality Initiative Training Channel Support Systems *Concurrent Engineering UNEP Green Programs Budget (5000) $ 0 5 Is $ olololololo 0.0% $ PROJECTED CUMULATIVE IMPACTS Material Cost Reduction Labor Cost Reduction Reduction R&D Cycle Time Reduction in Admin Costs Demand increase Worst Case Best Case 0.06 0.00 0.0% 0.0% 0.0% 0.0% 0.0% 0.0% 0.0% TQM INITIATIVES Benchmarking Quality Function Deployment Effort COE/6 Sigma Training GEMI TQEM Sustainability Initiatives $ S $ 5 Dolo 0 Reduction in Cost of Gede For the Year Just Ended 10 Admin Cost Reductions For the Year Just Ended R&D Cycle Time Reductions For the Year Just Ended 09 Demand increase For the Year Just Ended 19 ON Die AND O DE MacBook Research & Development DRAFT SAVED AT Dec 05.2020 23SAM CST Decisions Name Perceptual map (at end of the New Pfmn New Size MTBF Revision Date R&D Cost Age at Revision Art ($000) 9.6 10 Art Ant Ace Axe 12.7 5.2 7.9 10.6 0.0 26000 20000 22000 24000 14.9 12.2 7.6 0.0 14 88888 Acg NA 0 10 WI NA 0.0 0.0 0 $0 NA 0.0 0.0 0 $0 NA 0.0 0.0 0 SO Total $0 Material Cost ON New Age Profiles 100 35 510 $15 520 90 AH Art Ant Ace - AXE NA Ant LO 70 Ace 00 NA Axe Perceived gears 50 40 NA NA 20 MA 10 NA 0.0 Marketing DRAFT SAVED AT Due 05, 2020 09:35AM CST Marketing Decisions Name Price Promo Budget Sales Budget Benchmark Prediction * Your Sales Forecast Variable Costs Contrib Margin Forecast Less Promo & Sales 42.00 $ 26.00 $ 32.00 $ 40.00 $ Art Ant Ace Axe NA NA NA NA Total $ $ $ $ $0.0 $0.0 $0.0 $0.0 1200$ 1200 $ 1200 $ 1200 $ $0 $0 $0 $0 $ 4,800 1000 2000 1000 1000 $0 $0 1,485 768 1,957 2,044 0 0 0 0 6,254 OOOOO Gross Revenue Forecast Costs $ 62,375 $ 19,975 $ 62,617 $ 81,754 $0 $0 $0 $0 $ 226,720 $ 38,087 $ 10,969 $ 37,941 $ 52,714 SO $0 $0 $0 $ 139,711 $ 24,288 $ 9,005 $ 24,676 $ 29,041 $0 $0 $0 $0 $ 87,010 $ 22,088 $ 5,805 $ 22,476 $ 26,841 $0 $0 $0 $0 $ 77,210 $0 $0 $5,000 Note: The Benchmark Prediction estimates unit sales assuming your product competes with a standardized, mediocre playing field. It does not use your actual competitors products. It is useful for experimenting with price, promo and sales budgets. It is useless for forecasting A/R Lag (days) A/P Lag (days) 30 30 Revenue Forecast 500.000 570,000 550.000 $50,000 $40,000 $30.000 520000 $10.000 50 A Unit Sales Forecast 2.200 7.000 1,000 1,500 1.400 1.200 1.000 300 600 400 200 0 L. Ace NA NA NA Axe NA NA NA Variable Coats Marketing Margin After acting Ee Nane Core Thrift Decisions Proformas Inquirer Help Filc Undo Production DRAIT SAVED AT Dec 05. 20:00 AM CST Art Axe NA NA NA NA - 1,485 219 750 743 Ant 768 761 2150 2,129 Age 1,957 54 1800 1,782 2,044 267 950 941 ... Total 6,254 1,301 5,650 5,595 SCHEDULE Unit Sales Forecast Inventory On Hand Production Schedule Production After Adj. MARGINS *2nd Shift Production% Labor Cost/Unit Material Cost/Unit Total Unit Cost Contribution Margin PHYSICAL PLANT 1st Shift Capacity Buy/Sell Capacity Automation Rating New Autom. Rating Investment (5000) WORKFORCE Complement 5.1% $9.67 $15.98 $25.65 38.9% 90.3% $8.28 $6.00 $14.28 45.1% 50.0% $9.39 $10.00 $19.39 39.4% 30.5% $10.50 $15.29 $25.79 35.5% 0.0% $0.00 $0.00 $0.00 0.0% 0.0% $0.00 $0.00 $0.00 0.0% 0.0% $0.00 $0.00 $0.00 0.0% 0.0% $0.00 $0.00 $0.00 0.0% Total 3,772 0 714 0 4.0 4.0 $0 Last Year 804 1,130 0 6.0 6.0 $0 Needed 804 1,200 0 5.0 5.0 $0 This Year % 100% 728 0 4.0 4.0 $0 This Year 804 $0 ist Shift 552 $0 2nd Shift 252 $0 $0 Overtime 'Max Invest 0.0% AP Lag $0 $ 59,463 30 B Both Shits Base Capacty Production Production Vs. Capacity 2.500 Price Vs. Unit Cost 150 540 2.000 1,500 536 1.000 500 10 NA Human Resources DRAPT SAVED AT Dec 08, 20:20 00:36AM CST Staffing Labor Negotiations Last Year This Year 804 804 100% 100% 804 "Labor Negotiation Postion Demands Starting Celling $28.08 $ 25.53 $ 28.08 $2,750 $ 2,500 $2,750 2.2% 2.0% 2.2% 5.5% 5.0% 5.5% Hourly Wage Benefits Profit Sharing % Annual Raise 804 Current Contract $ 25.53 $ 2,500 2.0% 5.0% 525 552 279 252 0.0% 0.0% 10.0% Contract Expiration: 1-Oct-2024 Needed Complement Complement % *Complement '1st Shift Complement 2nd Shift Complement Overtime% "Turnover Rate "New Employees 'Separated Employees Recruiting Spend Training Hours Productivity Index Recruiting Cost Separation Cost Training Cost Total HR Admin Costs 140 0 10.0% 80 0 $0 $ 0 0 100.0% 0 100.0% $80 $0 $0 $80 Finance DRAFT SAVED AT Dec 05, 2030AM CST Liabilities & Owner's Equity Common Stock $0 $0 Retained wings Long Terms 2,051 $ 95.38 $ 12.37 Ourent Dell Accounts Payable $ 39,125 inances LANT IMPROVEMENTS *Total Investments ($000) Sales Of Plant & Equipment COMMON STOCK Shares Outstanding (000) Price Per Share Eamnings Per Share "Max Stock Issue (5000) Issue Stock (5000) *Max Stock Retire (5000) "Retire Stock (5000) "Dividend Per Share CURRENT DEBT Interest Rate Due. This Year Borrow (5000) CASH POSITIONS December 31, 2019 December 31, 2020 $ 0 $ 9,781 0 Long Term Debt Retire Long Term Debt (5000) fase Long Term Debt (5000) Long Term Interest Rate "Maximum Issue This Year . $ $ $ 0.00 11.4% $ 14,722 30 A Lag (days) "A/P Lag (days) JO 10.0% $ 15,717 0 Outstanding Bonds Sene Number "Face Amount 50 13.552021 5 11,300 11.25 2026 $ 3,837 11.952022 $7,072 Current Yield 13.04 11.3 11.696 2019 Con 5 103.58 $99.07 $ 102.54 $ 31,543 $41,406 TQM Initiative DRAIT SAVED AT DE 20 SAM CST Process Management Initiatives Projected Impact Total Current Expenditures (5000): $0 CPI Systems Vendor/JIT Quality Initiative Training Channel Support Systems *Concurrent Engineering UNEP Green Programs Budget (5000) $ 0 5 Is $ olololololo 0.0% $ PROJECTED CUMULATIVE IMPACTS Material Cost Reduction Labor Cost Reduction Reduction R&D Cycle Time Reduction in Admin Costs Demand increase Worst Case Best Case 0.06 0.00 0.0% 0.0% 0.0% 0.0% 0.0% 0.0% 0.0% TQM INITIATIVES Benchmarking Quality Function Deployment Effort COE/6 Sigma Training GEMI TQEM Sustainability Initiatives $ S $ 5 Dolo 0 Reduction in Cost of Gede For the Year Just Ended 10 Admin Cost Reductions For the Year Just Ended R&D Cycle Time Reductions For the Year Just Ended 09 Demand increase For the Year Just Ended 19 ON Die AND O DE MacBook