

Question: Research Papers The following scatterplot shows the grades for research papers for a sociologist's class plotted against the times spent (in hours) on doing the
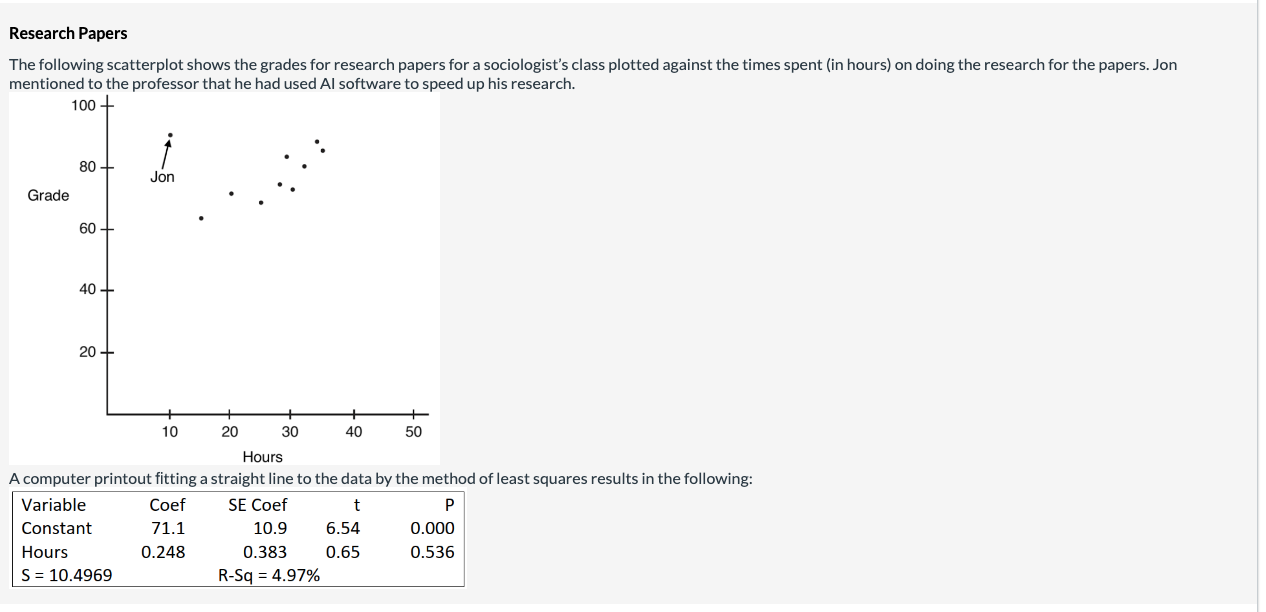
Research Papers The following scatterplot shows the grades for research papers for a sociologist's class plotted against the times spent (in hours) on doing the research for the papers. Jon mentioned to the professor that he had used Al software to speed up his research. 100 80 Grade 60 40 20 10 20 30 40 50 Hours A computer printout fitting a straight line to the data by the method of least squares results in the following: Variable Coef SE Coef t P Constant 71.1 10.9 6.54 0.000 Hours 0.248 0.383 0.65 0.536 5=10.4969 R-Sq=4.97%
Step by Step Solution
There are 3 Steps involved in it
1 Expert Approved Answer
Step: 1 Unlock

Question Has Been Solved by an Expert!
Get step-by-step solutions from verified subject matter experts
Step: 2 Unlock
Step: 3 Unlock