

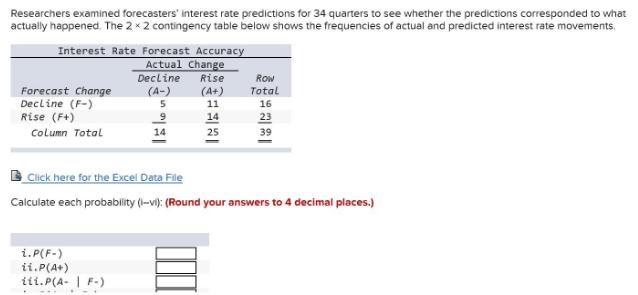
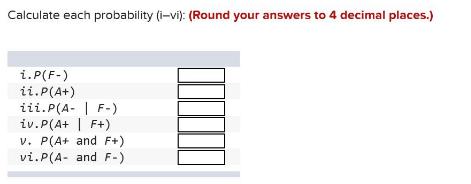
Researchers examined forecasters' interest rate predictions for 34 quarters to see whether the predictions corresponded to...
Fantastic news! We've Found the answer you've been seeking!
Question:
Expert Answer:

Related Book For 

Applied Statistics in Business and Economics
ISBN: 978-0073521480
4th edition
Authors: David Doane, Lori Seward
Posted Date:
