

Question: Residuals Statistics Minimum Maximum Mean Std. Deviation N Predicted Value .799 9.992 5.010 2.0077 50 Std. Predicted Value -2.097 2.481 .000 1.000 50 Standard
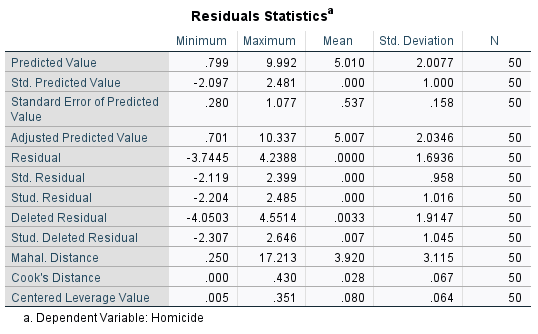
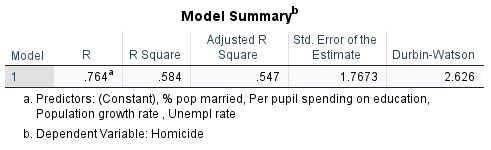
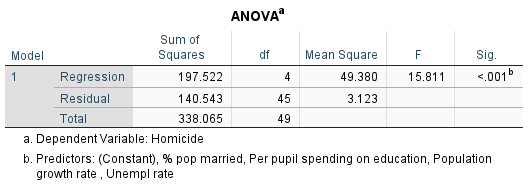
Residuals Statistics Minimum Maximum Mean Std. Deviation N Predicted Value .799 9.992 5.010 2.0077 50 Std. Predicted Value -2.097 2.481 .000 1.000 50 Standard Error of Predicted .280 1.077 .537 .158 50 Value Adjusted Predicted Value .701 10.337 5.007 2.0346 50 Residual -3.7445 4.2388 .0000 1.6936 50 Std. Residual -2.119 2.399 .000 .958 50 Stud. Residual -2.204 2.485 .000 1.016 50 Deleted Residual -4.0503 4.5514 .0033 1.9147 50 Stud. Deleted Residual -2.307 2.646 .007 1.045 50 Mahal. Distance .250 17.213 3.920 3.115 50 Cook's Distance .000 .430 .028 .067 50 Centered Leverage Value .005 .351 .080 .064 50 a. Dependent Variable: Homicide Model Summary" Model R R Square Adjusted R Square Std. Error of the Estimate Durbin-Watson 1 .764 .584 .547 1.7673 2.626 a. Predictors: (Constant), % pop married, Per pupil spending on education, Population growth rate, Unempl rate b. Dependent Variable: Homicide Model 1 Residual Total Regression Sum of ANOVA Squares df Mean Square F Sig. 197.522 4 49.380 15.811
Step by Step Solution
There are 3 Steps involved in it

Get step-by-step solutions from verified subject matter experts