

Question: resource website: https://www.nejm.org/doi/full/10.1056ejmoa1403285 Table 2. Main Clinical Outcomes.# Variable Simvastatin Placebo Student's t-Test Bootstrapped t-Test Difference or Risk Ratio Difference (95% CI) P Value (95%

resource website: https://www.nejm.org/doi/full/10.1056ejmoa1403285
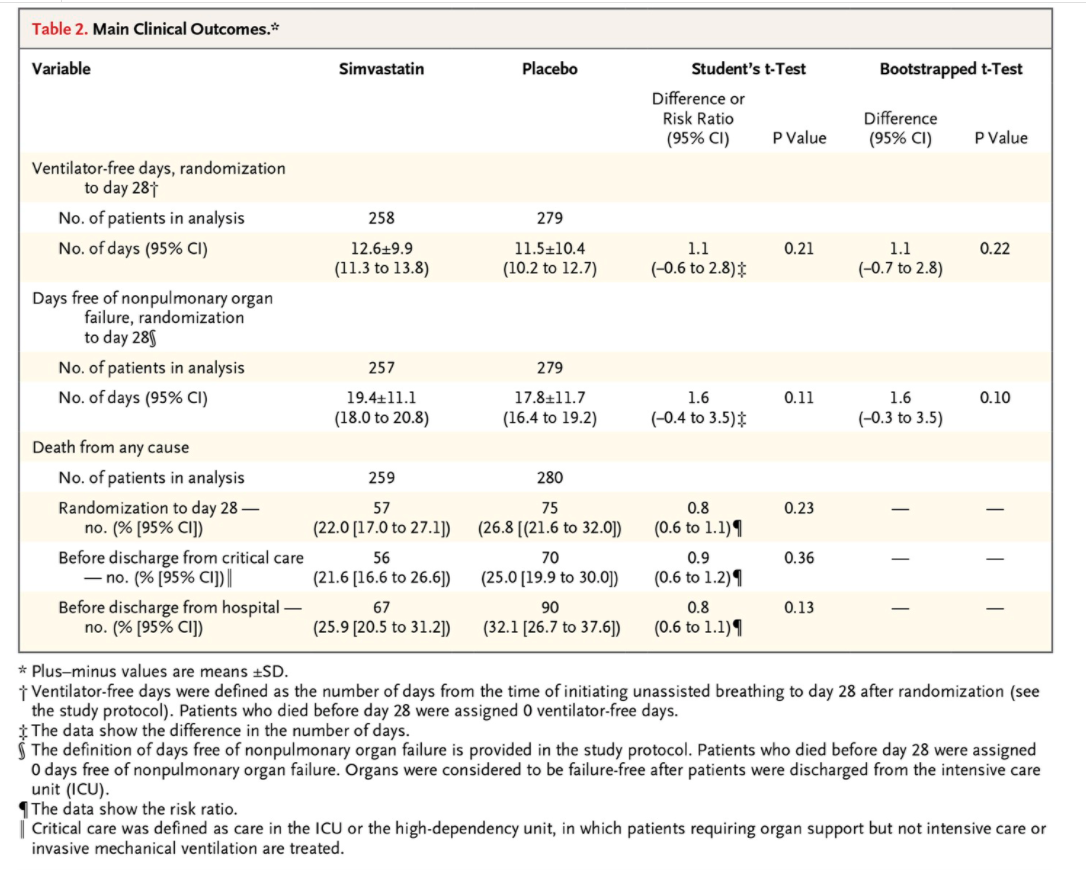

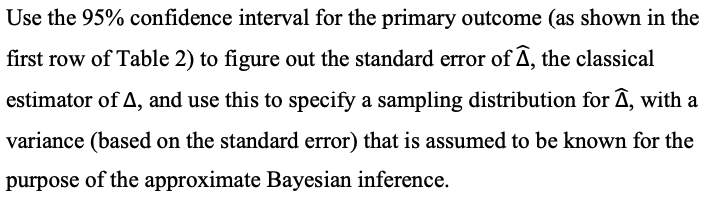
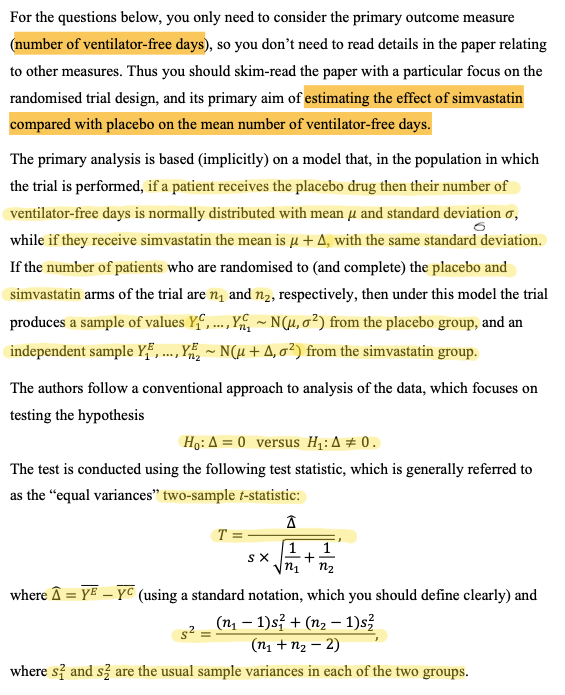
Table 2. Main Clinical Outcomes.# Variable Simvastatin Placebo Student's t-Test Bootstrapped t-Test Difference or Risk Ratio Difference (95% CI) P Value (95% CI) P Value Ventilator-free days, randomization to day 281 No. of patients in analysis 258 279 No. of days (95% CI) 12.619.9 11.5+10.4 1.1 0.21 1.1 0.22 (11.3 to 13.8) (10.2 to 12.7) (-0.6 to 2.8) (-0.7 to 2.8) Days free of nonpulmonary organ failure, randomization to day 289 No. of patients in analysis 257 279 No. of days (95% CI) 19.4+11.1 17.8+11.7 1.6 0.11 1.6 0.10 (18.0 to 20.8) (16.4 to 19.2) (-0.4 to 3.5)$ (-0.3 to 3.5) Death from any cause No. of patients in analysis 259 280 Randomization to day 28 - 57 75 0.8 0.23 no. (% [95% CI]) (22.0 [17.0 to 27.1]) (26.8 [(21.6 to 32.0]) (0.6 to 1.1) 1 Before discharge from critical care 56 70 0.9 0.36 - no. (% [95% CI]) | (21.6 [16.6 to 26.6]) (25.0 [19.9 to 30.0]) (0.6 to 1.2) 1 Before discharge from hospital - 67 90 0.8 0.13 no. (% [95% CI]) (25.9 [20.5 to 31.2]) (32.1 [26.7 to 37.6]) (0.6 to 1.1) 1 * Plus-minus values are means +SD. i Ventilator-free days were defined as the number of days from the time of initiating unassisted breathing to day 28 after randomization (see the study protocol). Patients who died before day 28 were assigned 0 ventilator-free days. $ The data show the difference in the number of days. The definition of days free of nonpulmonary organ failure is provided in the study protocol. Patients who died before day 28 were assigned 0 days free of nonpulmonary organ failure. Organs were considered to be failure-free after patients were discharged from the intensive care unit (ICU). The data show the risk ratio. Critical care was defined as care in the ICU or the high-dependency unit, in which patients requiring organ support but not intensive care or invasive mechanical ventilation are treated.For the questions below, you only need to consider the primary outcome measure (number of ventilator-free days), so you don't need to read details in the paper relating to other measures. Thus you should skim-read the paper with a particular focus on the randomised trial design, and its primary aim of estimating the effect of simvastatin compared with placebo on the mean number of ventilator-free days. The primary analysis is based (implicitly) on a model that, in the population in which the trial is performed, if a patient receives the placebo drug then their number of ventilator-free days is normally distributed with mean / and standard deviation o, while if they receive simvastatin the mean is / + 4, with the same standard deviation. If the number of patients who are randomised to (and complete) the placebo and simvastatin arms of the trial are n, and n2, respectively, then under this model the trial produces a sample of values Yf, ..., Y, ~ N(u, 62) from the placebo group, and an independent sample YF, ..., Yng ~ N(u + A, o') from the simvastatin group. The authors follow a conventional approach to analysis of the data, which focuses on testing the hypothesis Ho: 4 = 0 versus H1:4 # 0. The test is conducted using the following test statistic, which is generally referred to as the "equal variances" two-sample f-statistic: T = SX 1 + 1 n1 nz where A = YE - YC (using a standard notation, which you should define clearly) and (n - 1)s, + (n2 - 1)s2 (n1 + n2 - 2) where s? and s are the usual sample variances in each of the two groups.Use the 95% confidence interval for the primary outcome (as shown in the first row of Table 2) to figure out the standard error of A, the classical estimator of A, and use this to specify a sampling distribution for 4, with a variance (based on the standard error) that is assumed to be known for the purpose of the approximate Bayesian inference
Step by Step Solution
There are 3 Steps involved in it

Get step-by-step solutions from verified subject matter experts