

Question: Responsibility Accounting and Performance Evaluation Using Excel for key performance indicators(KPIs) The US Solar Company has data for the four divisions for the year, and
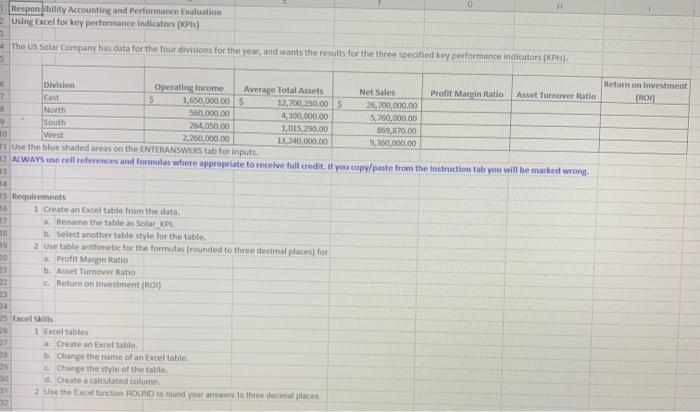
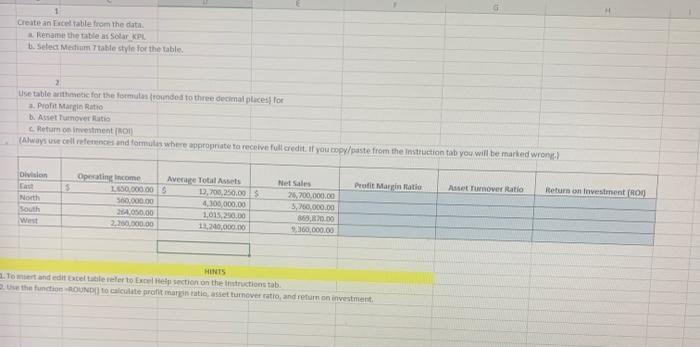
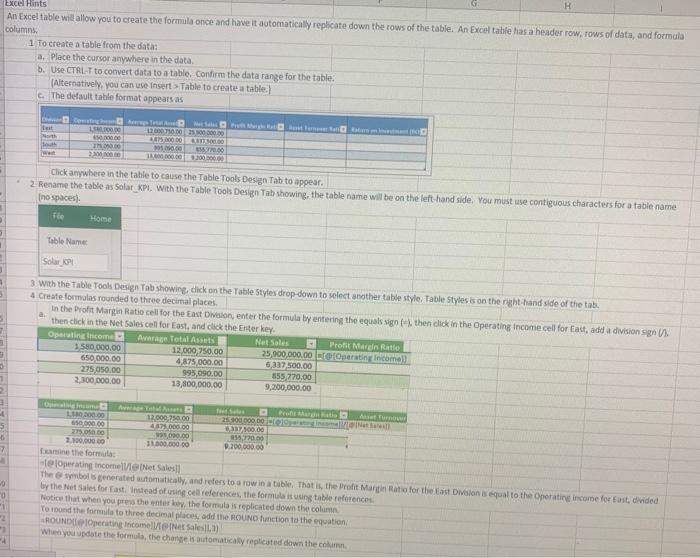
Responibility Accounting and Performance Evaluation Using Excel for key performance Indicators (KPI) The US Solar Company has data for the four divisions for the year, and wants the results for the three specified key performance indicators (KPIS) Return on investment (HOU Division Operating income Average Total Assets Net Sales Profit Martin Statio Asset Turnover Ratio 7 East S 1.650,000.00 12,700,250.00 $ 26,700,000.00 North 560,000.00 4,300,000.00 5,700,000.00 South 264.050.00 1,015,290.00 369,870.00 10 West 2,250,000.00 13.340,000.00 3,360,000.00 1 Use the blue shadedress on the ENTERANSWELS tab for inputs 12 ALWAYS e cell references and formulas where appropriate to receive full credit. If you copy/paste from the instruction tab you will be marked wrong 56 5 Requirements 16 1 Create an Excel table from the data 17 Rename the table as Solar KPI 11 b Select another table style for the table. 19 2 Use table arithmetic for the formules rounded to three decimal places) for 20 Profit Marin Ratio 21 Asset Turnover Ratio 22 Return on investment (ROI) 34 35. Si 1 Excel tables 22 Create an Excel table 1. Change the name of an Excel table Change the style of the table. 00 d. Create a calculated column. 31 2. Use the Excel function ROUND o round your answer to the decimal places Create an Excel table from the data Rename the table as Solar KPL . Select Mesum table style for the table 2 Une table arithmetic for the formulas onded to three decimal places for 3. Pro Mangi Ratio b. Asset Turnoverato Return on investment (RON (Always use cell references and formules where appropriate to receive full credit. If you copy/paste from the instruction tab you will be marked wront) loivision 3 Profit Margin Ratio Asset Turnover Ratio Return on investment RON North South West Operating Income 650.000,00 500.000.00 MA050.00 2.000.00 Average Total Assets 13.200.250.00 4,100,000.00 1.01.250.00 11,20,000.00 Net Sales 26.700,000.00 5,700,000.00 859,800 9.300,000.00 HINTS To and edit Excel table refer to Excel pection on the instructions tab 2. Use the functie BOUND to calculate profit margintate setturnover ratio, and return on investment H Excel Hints An Excel table will allow you to create the formula once and have it automatically replicate down the rows of the table. An Excel table hasa header row, rows of data, and formula columns 1 To create a table from the data: a. Place the cursor anywhere in the data b. Use CTRL-T to convert data to a table. Confirm the data range for the table. (Alternatively, you can use Insert > Table to create a table) The default table format appears as 10000 North 1200000000000 4000 DO 00:00 1010 IM 220000 Click anywhere in the table to cause the Table Tools Design Tab to appear. 2. Rename the table as solar_KPL. With the Table Tools Design Tab showing the table name will be on the left-hand side. You must use contiguous characters for a table name (no spacesi Tie Home Table Name Solar 3 With the Table Tools Design Tab showing, click on the Table Styles drop down to select another table style. Table Styles is on the right hand side of the tab. 4 Create formulas rounded to three decimal places In the profit Margin Ratio cell for the East Division, enter the formula by entering the equals sign then click in the Operating Income cell for East, add a division signi then click in the Net Sales cell for East, and click the Enter key Operating income Average Total Assets Net Soles Profit Margin Rate 1580,000.00 12.000 750.00 25,000,000.00 Operating comel 650,000.00 4.875,000.00 6.217500.00 275,050.00 995090.00 555 270.00 2,100,000.00 13,800,000.00 9,200,000.00 1 4 5 7 200.00 13.000 750.00 25.000.000,00 RON 650 000.00 4.000.00 3700.00 275.00 500.00 15.770.00 200.000.00 300.000.00 9.200.000,00 Examine the formula te loperating incomeVeNet Sales The symbolis generated automatically and refers to a row in a table. That is, the Profit Margin Ratio for the East Division 8 equal to the Operating income for East, divided by the Net Sales for fast. Instead of using cel references, the formula is ng table references Notice that when you press the enter key, the formula is replicated down the column To round the forma to three decimal places and the ROUND Runction to the equation ROUND Operating Income Sales When you update the formula, the changes automatically replicated down the com .. 2 4
Step by Step Solution
There are 3 Steps involved in it

Get step-by-step solutions from verified subject matter experts