

Question: ression, and the data shown pute the following: (a) the Exercise One: Using your knowledge of Excel and Linear Reg below for Bombardier Corporation, as
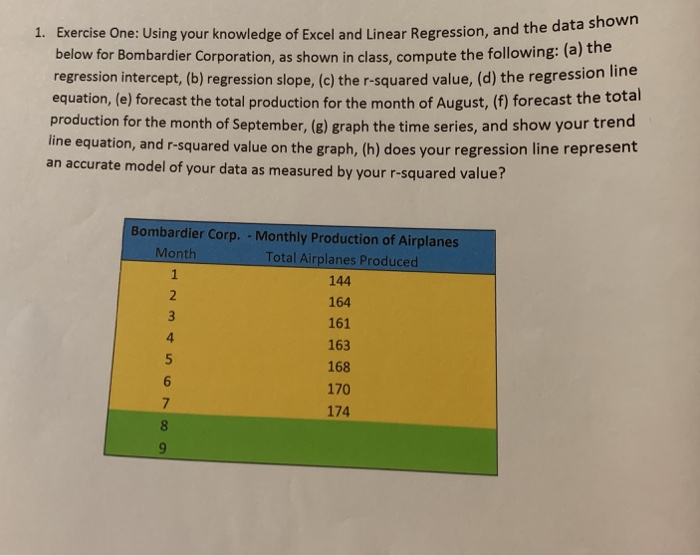
ression, and the data shown pute the following: (a) the Exercise One: Using your knowledge of Excel and Linear Reg below for Bombardier Corporation, as shown in class, com regression intercept, (b) regression slope, (c) the r-squared value, (d) the regression lin equation, (e) forecast the total production for the month of August, (f) forecast the tota production for the month of September, (g) graph the time series, and show your trend line equation, and r-squared value on the graph, (h) does your regression line represent an accurate model of your data as measured by your r-squared value? 1. Bombardier Corp. - Monthly Production of Airplanes Month Total Airplanes Produced 144 164 161 163 168 170 174 4 7 ression, and the data shown pute the following: (a) the Exercise One: Using your knowledge of Excel and Linear Reg below for Bombardier Corporation, as shown in class, com regression intercept, (b) regression slope, (c) the r-squared value, (d) the regression lin equation, (e) forecast the total production for the month of August, (f) forecast the tota production for the month of September, (g) graph the time series, and show your trend line equation, and r-squared value on the graph, (h) does your regression line represent an accurate model of your data as measured by your r-squared value? 1. Bombardier Corp. - Monthly Production of Airplanes Month Total Airplanes Produced 144 164 161 163 168 170 174 4 7
Step by Step Solution
There are 3 Steps involved in it

Get step-by-step solutions from verified subject matter experts