

Question: Results Part A TABLE 1: The table below shows data gathered from the experiment using the ET252 software with varying illuminance at constant temperature of
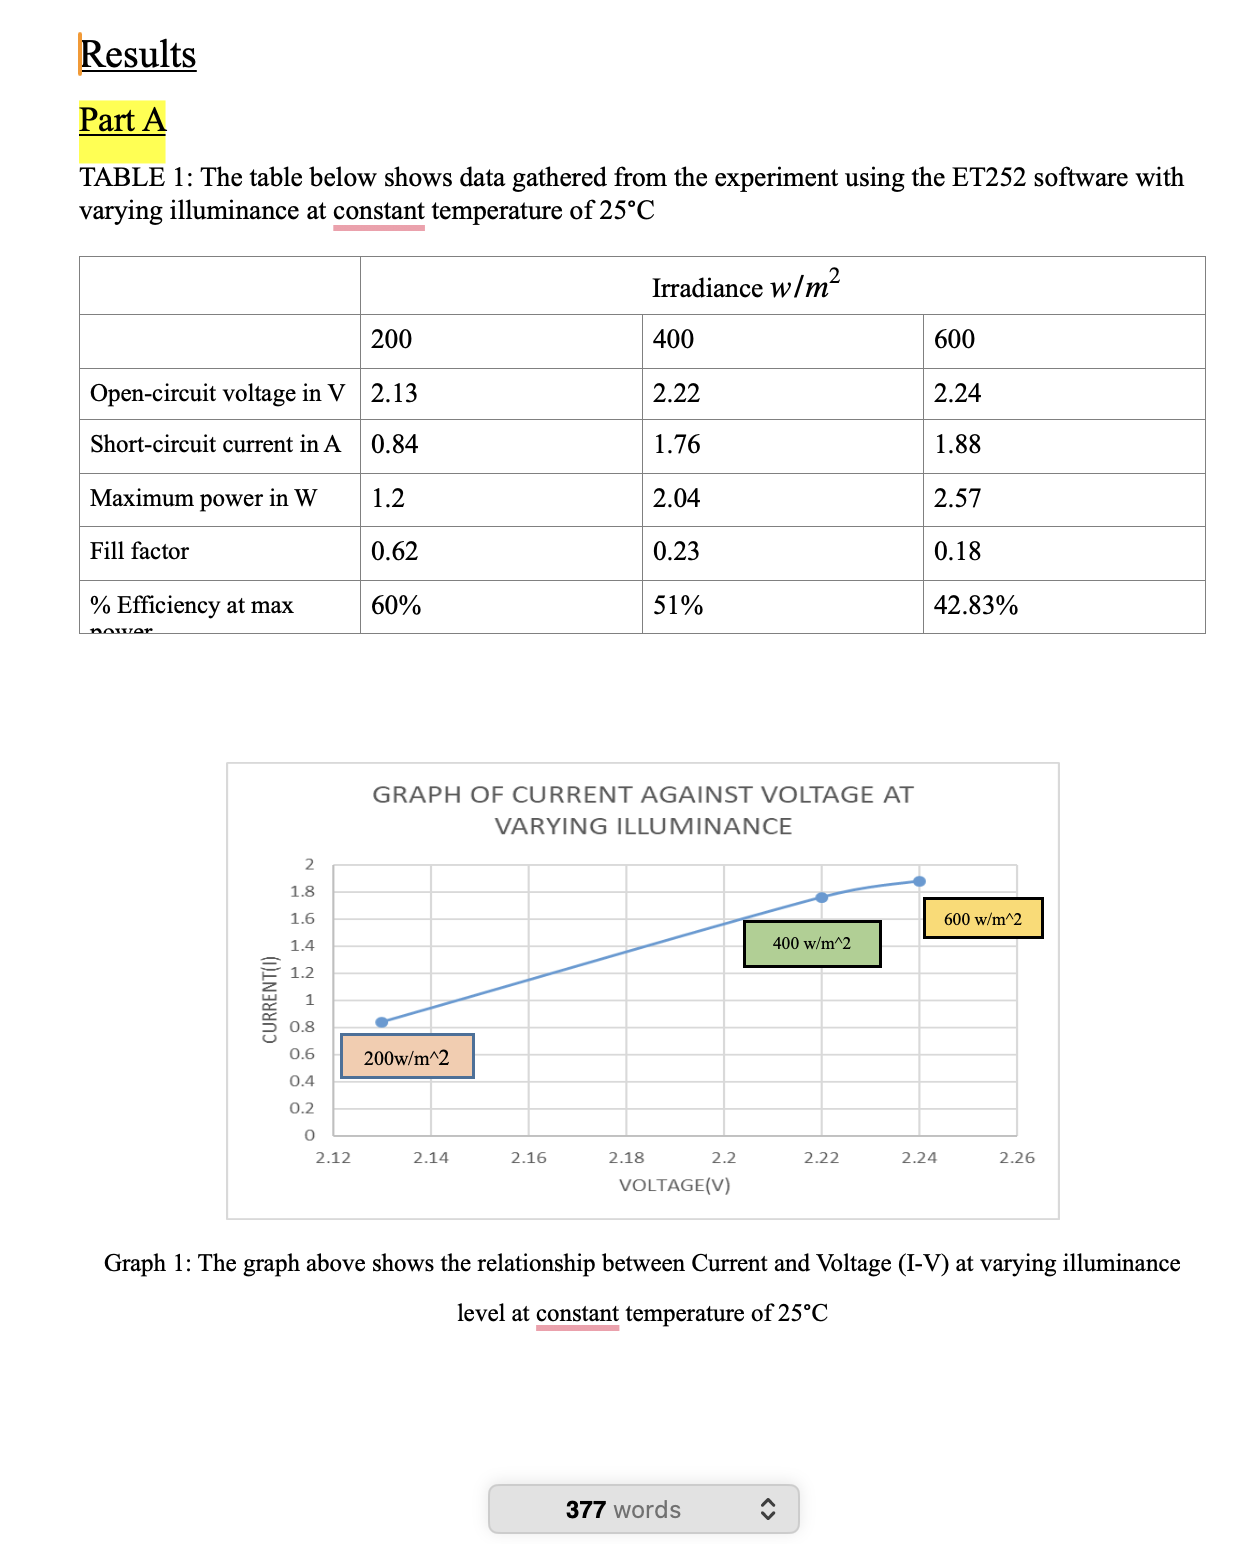
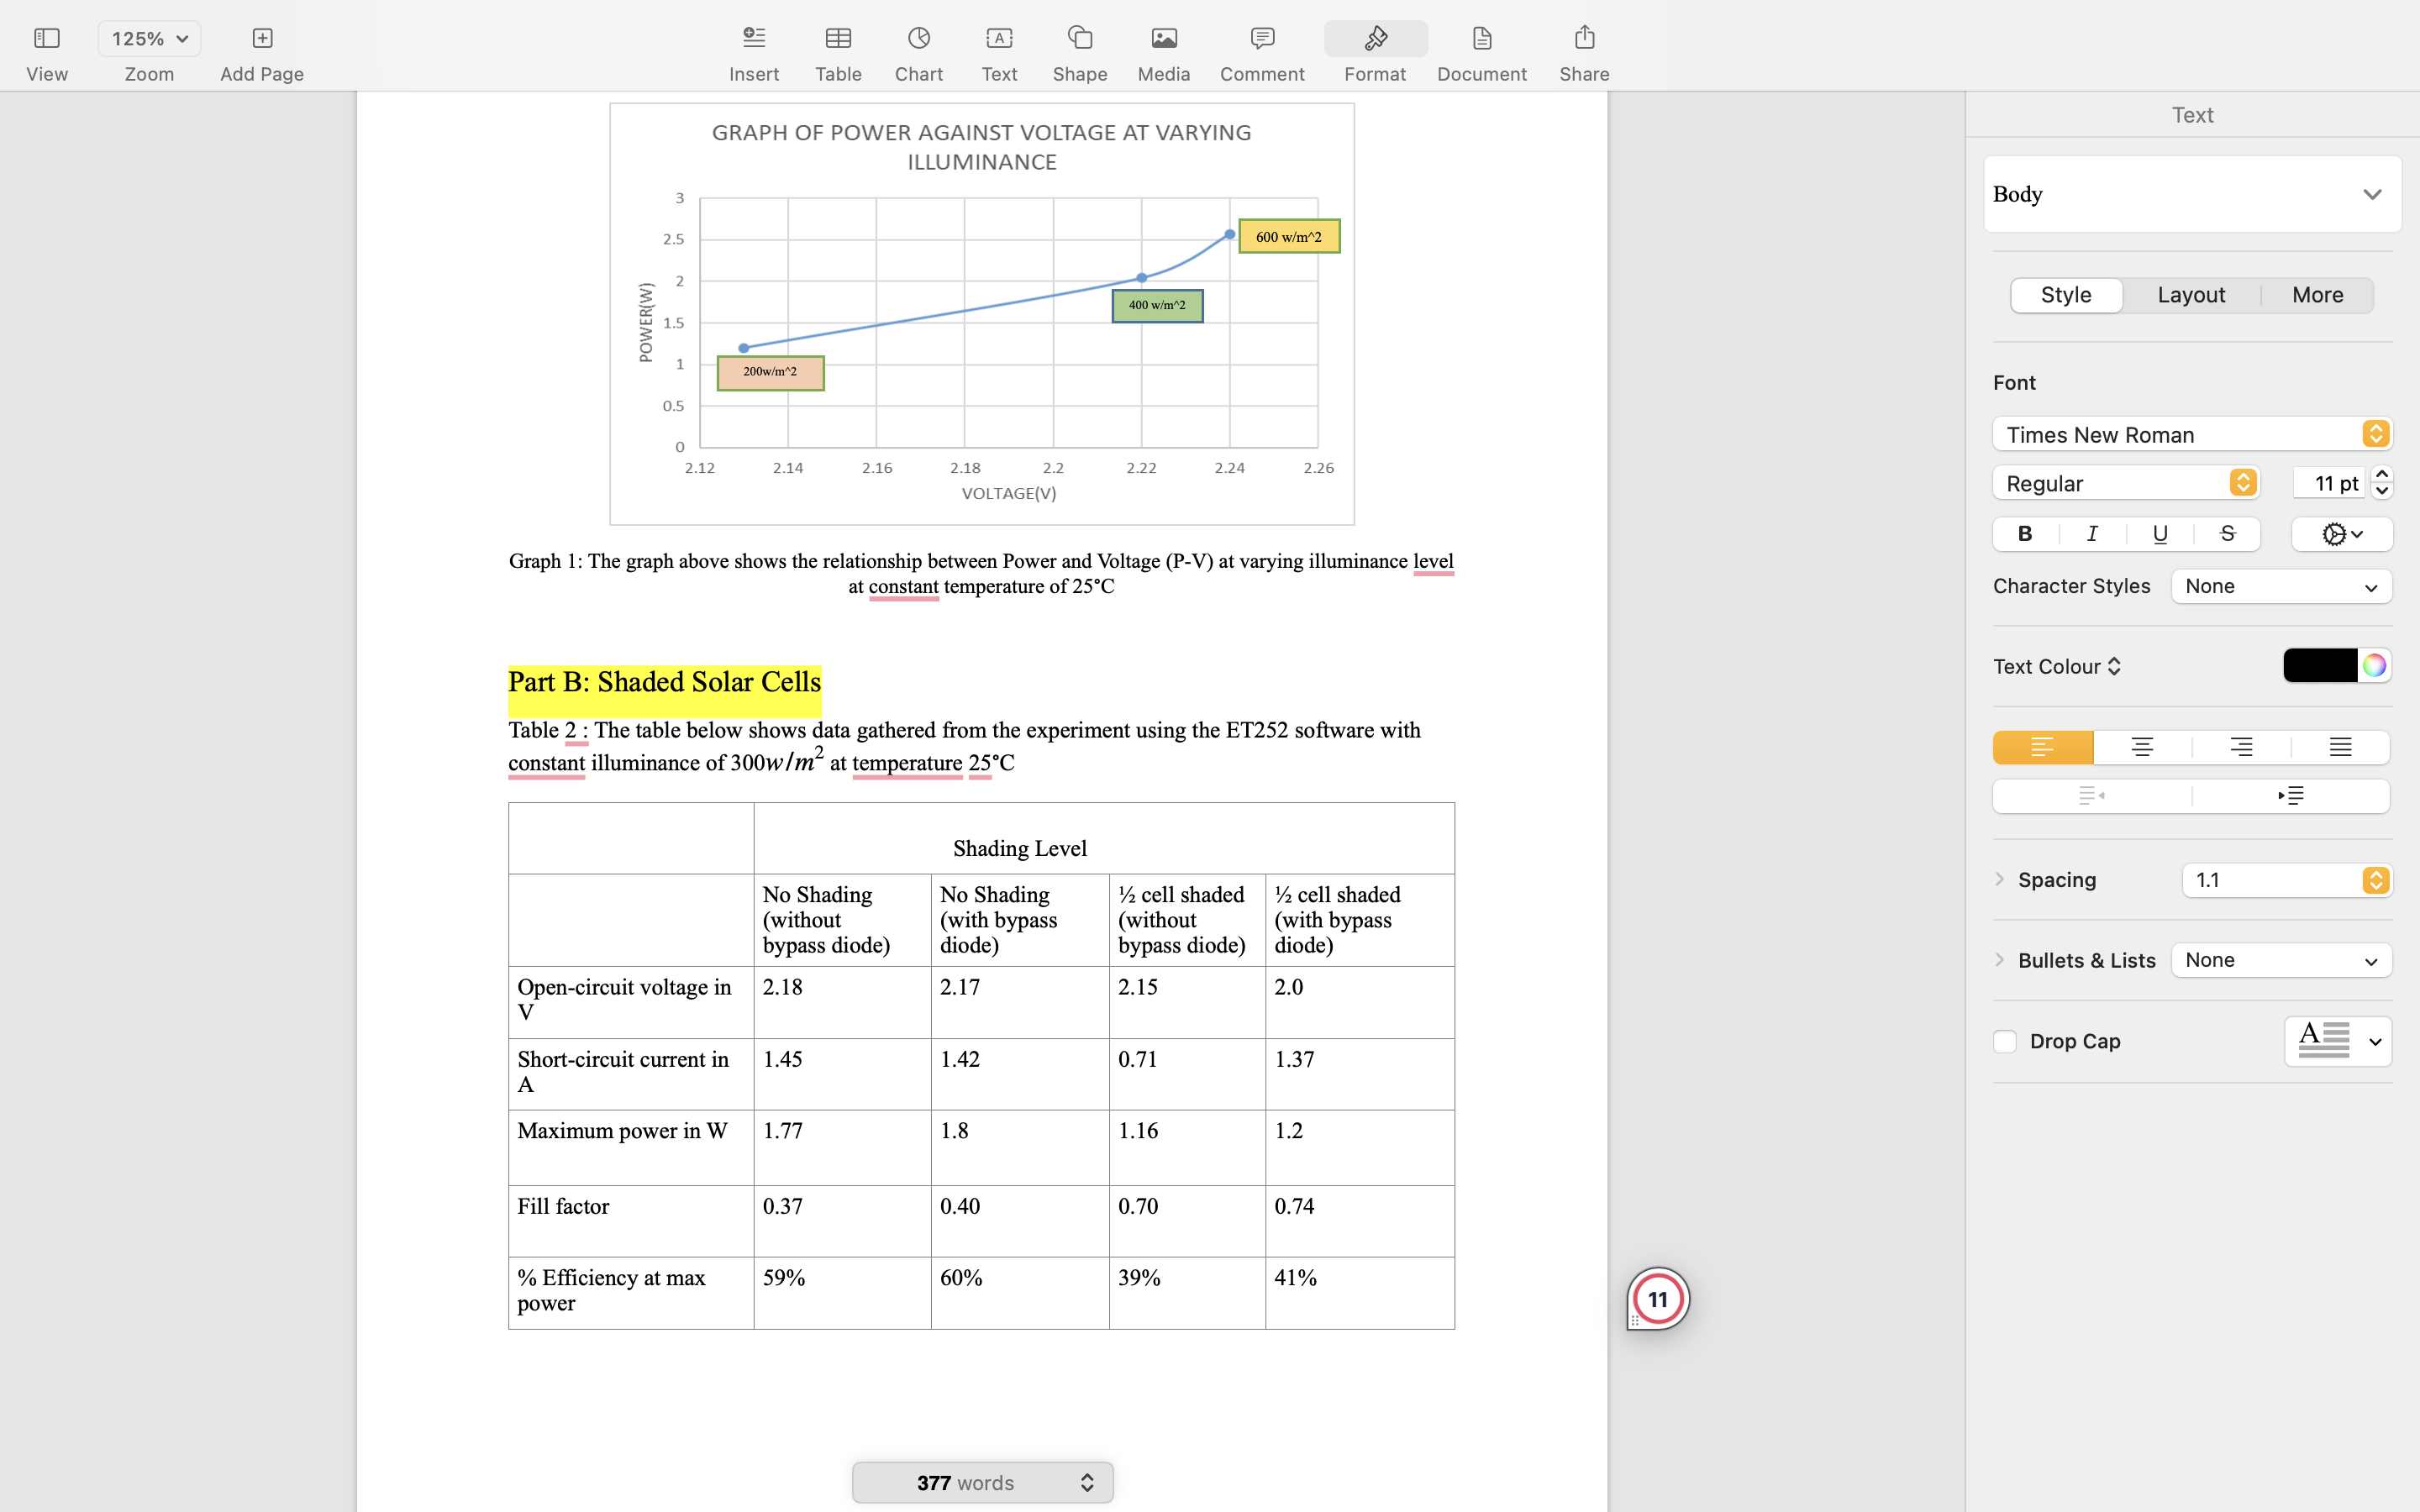
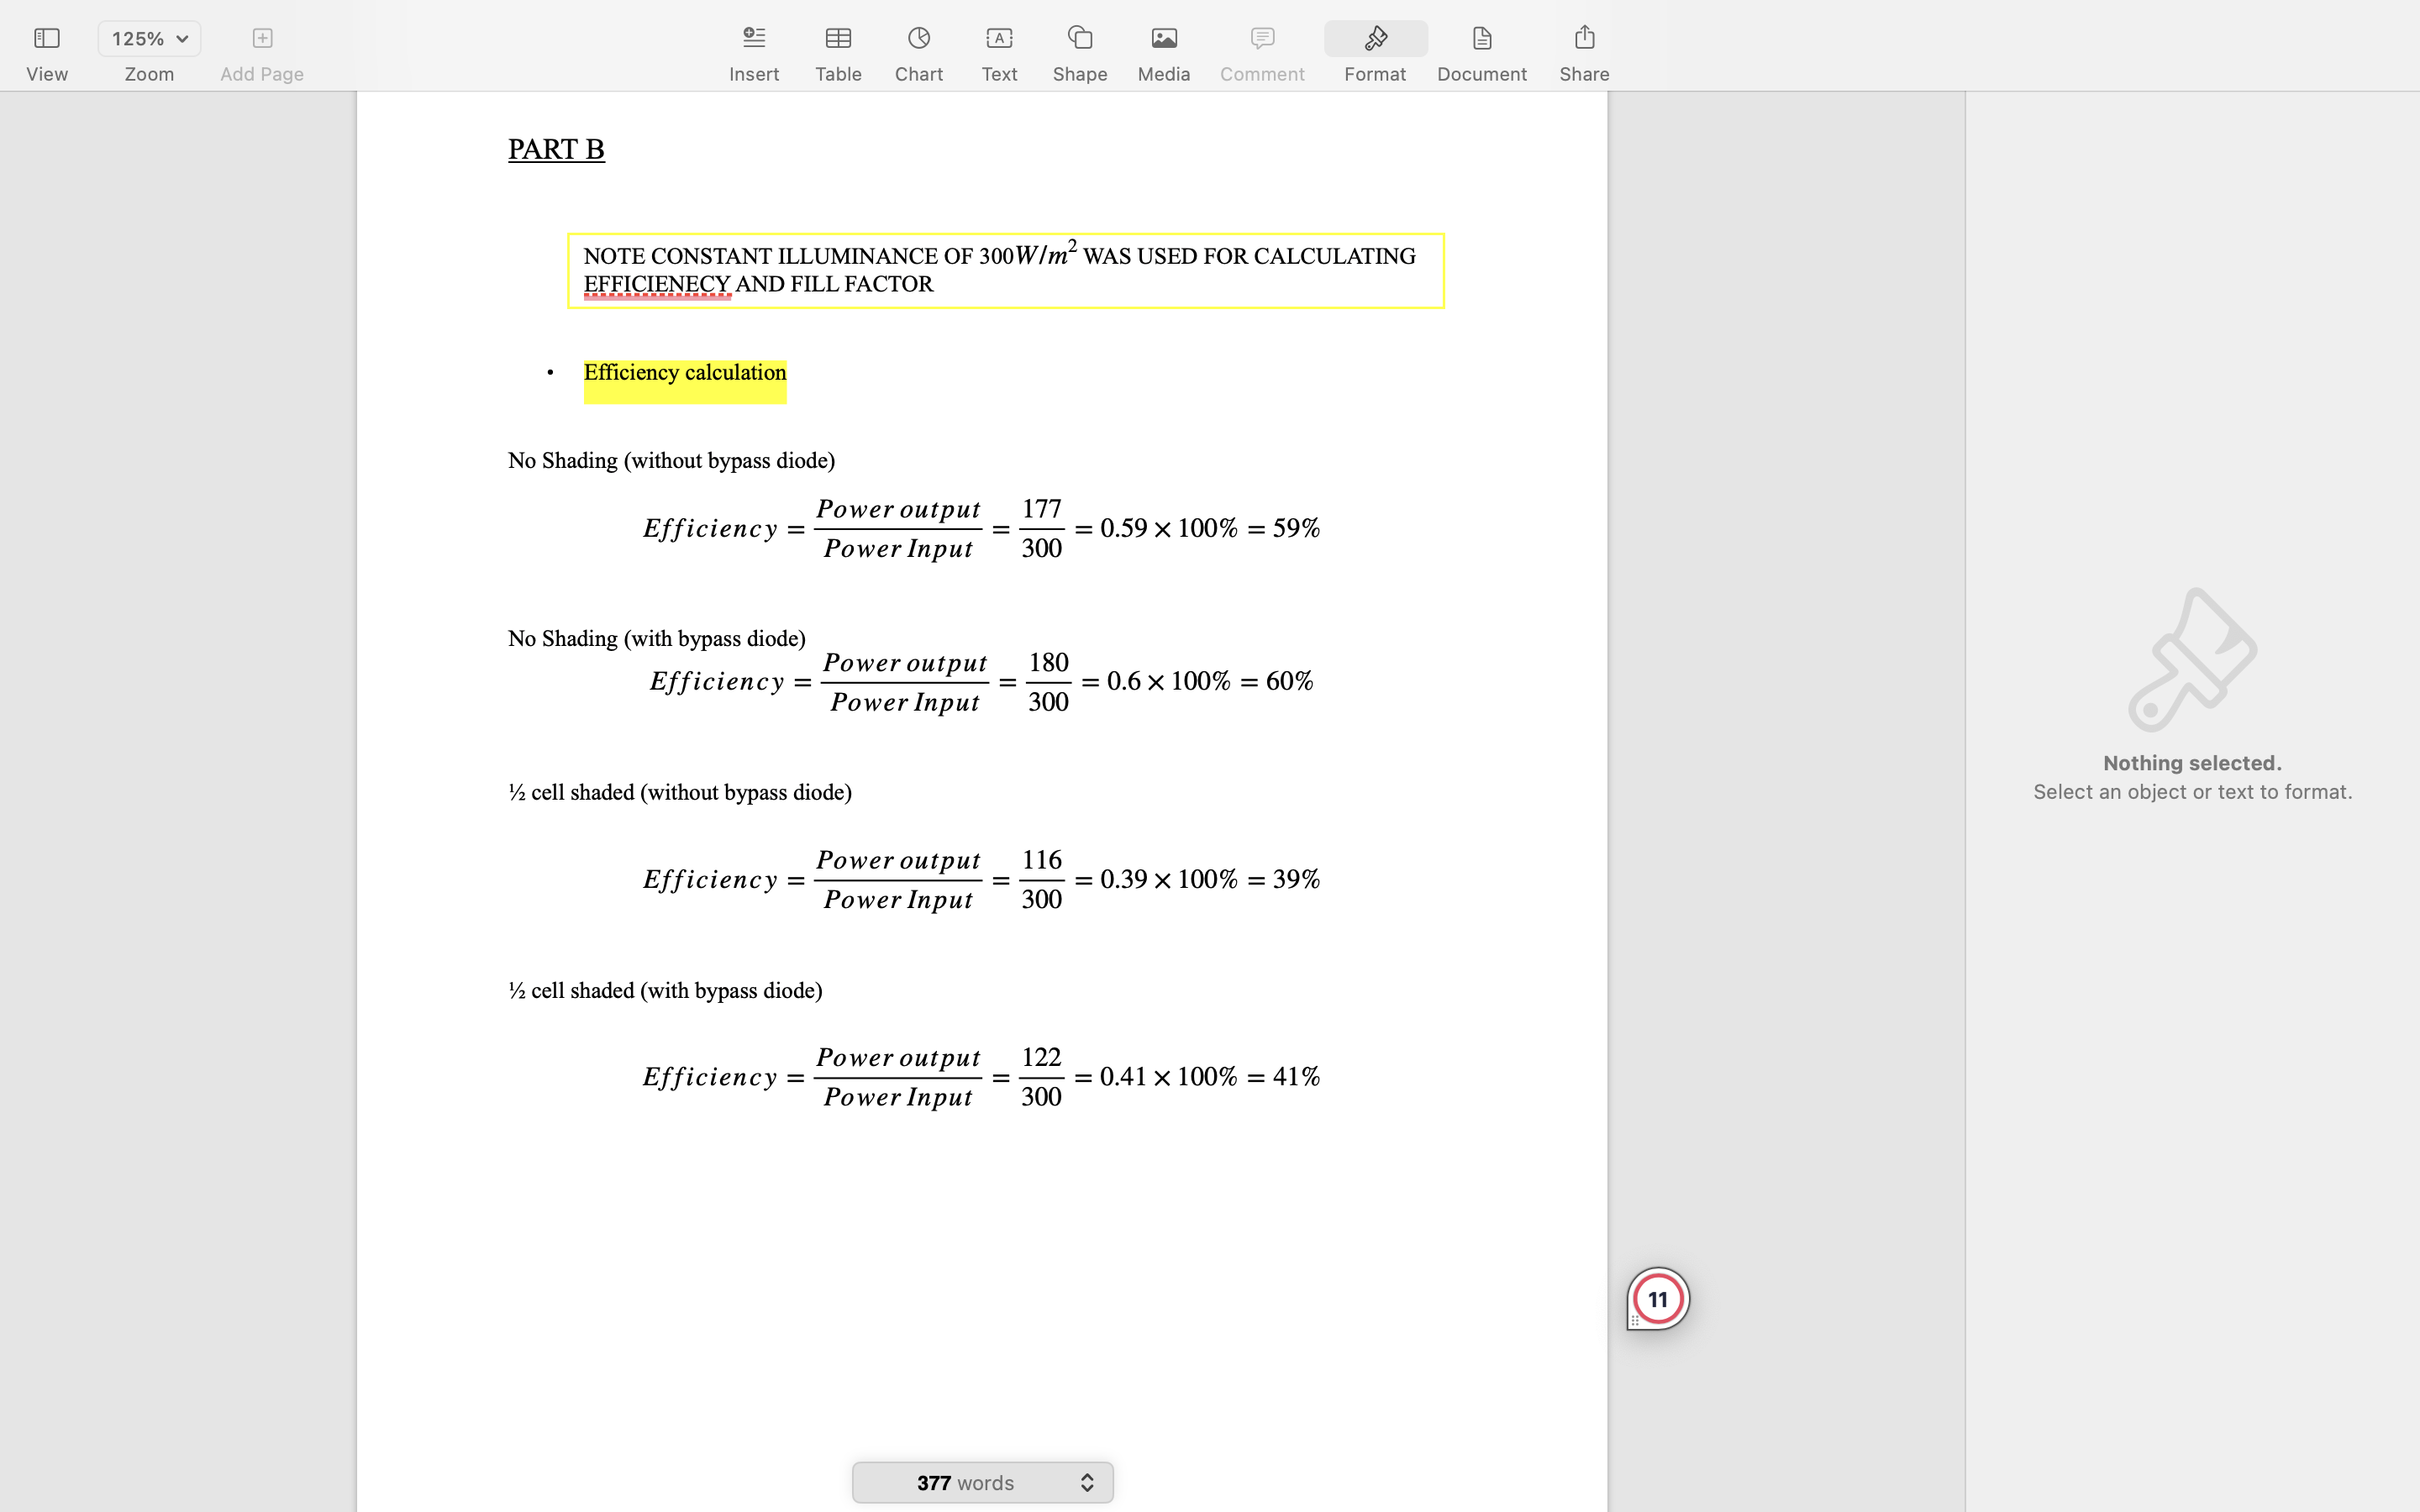
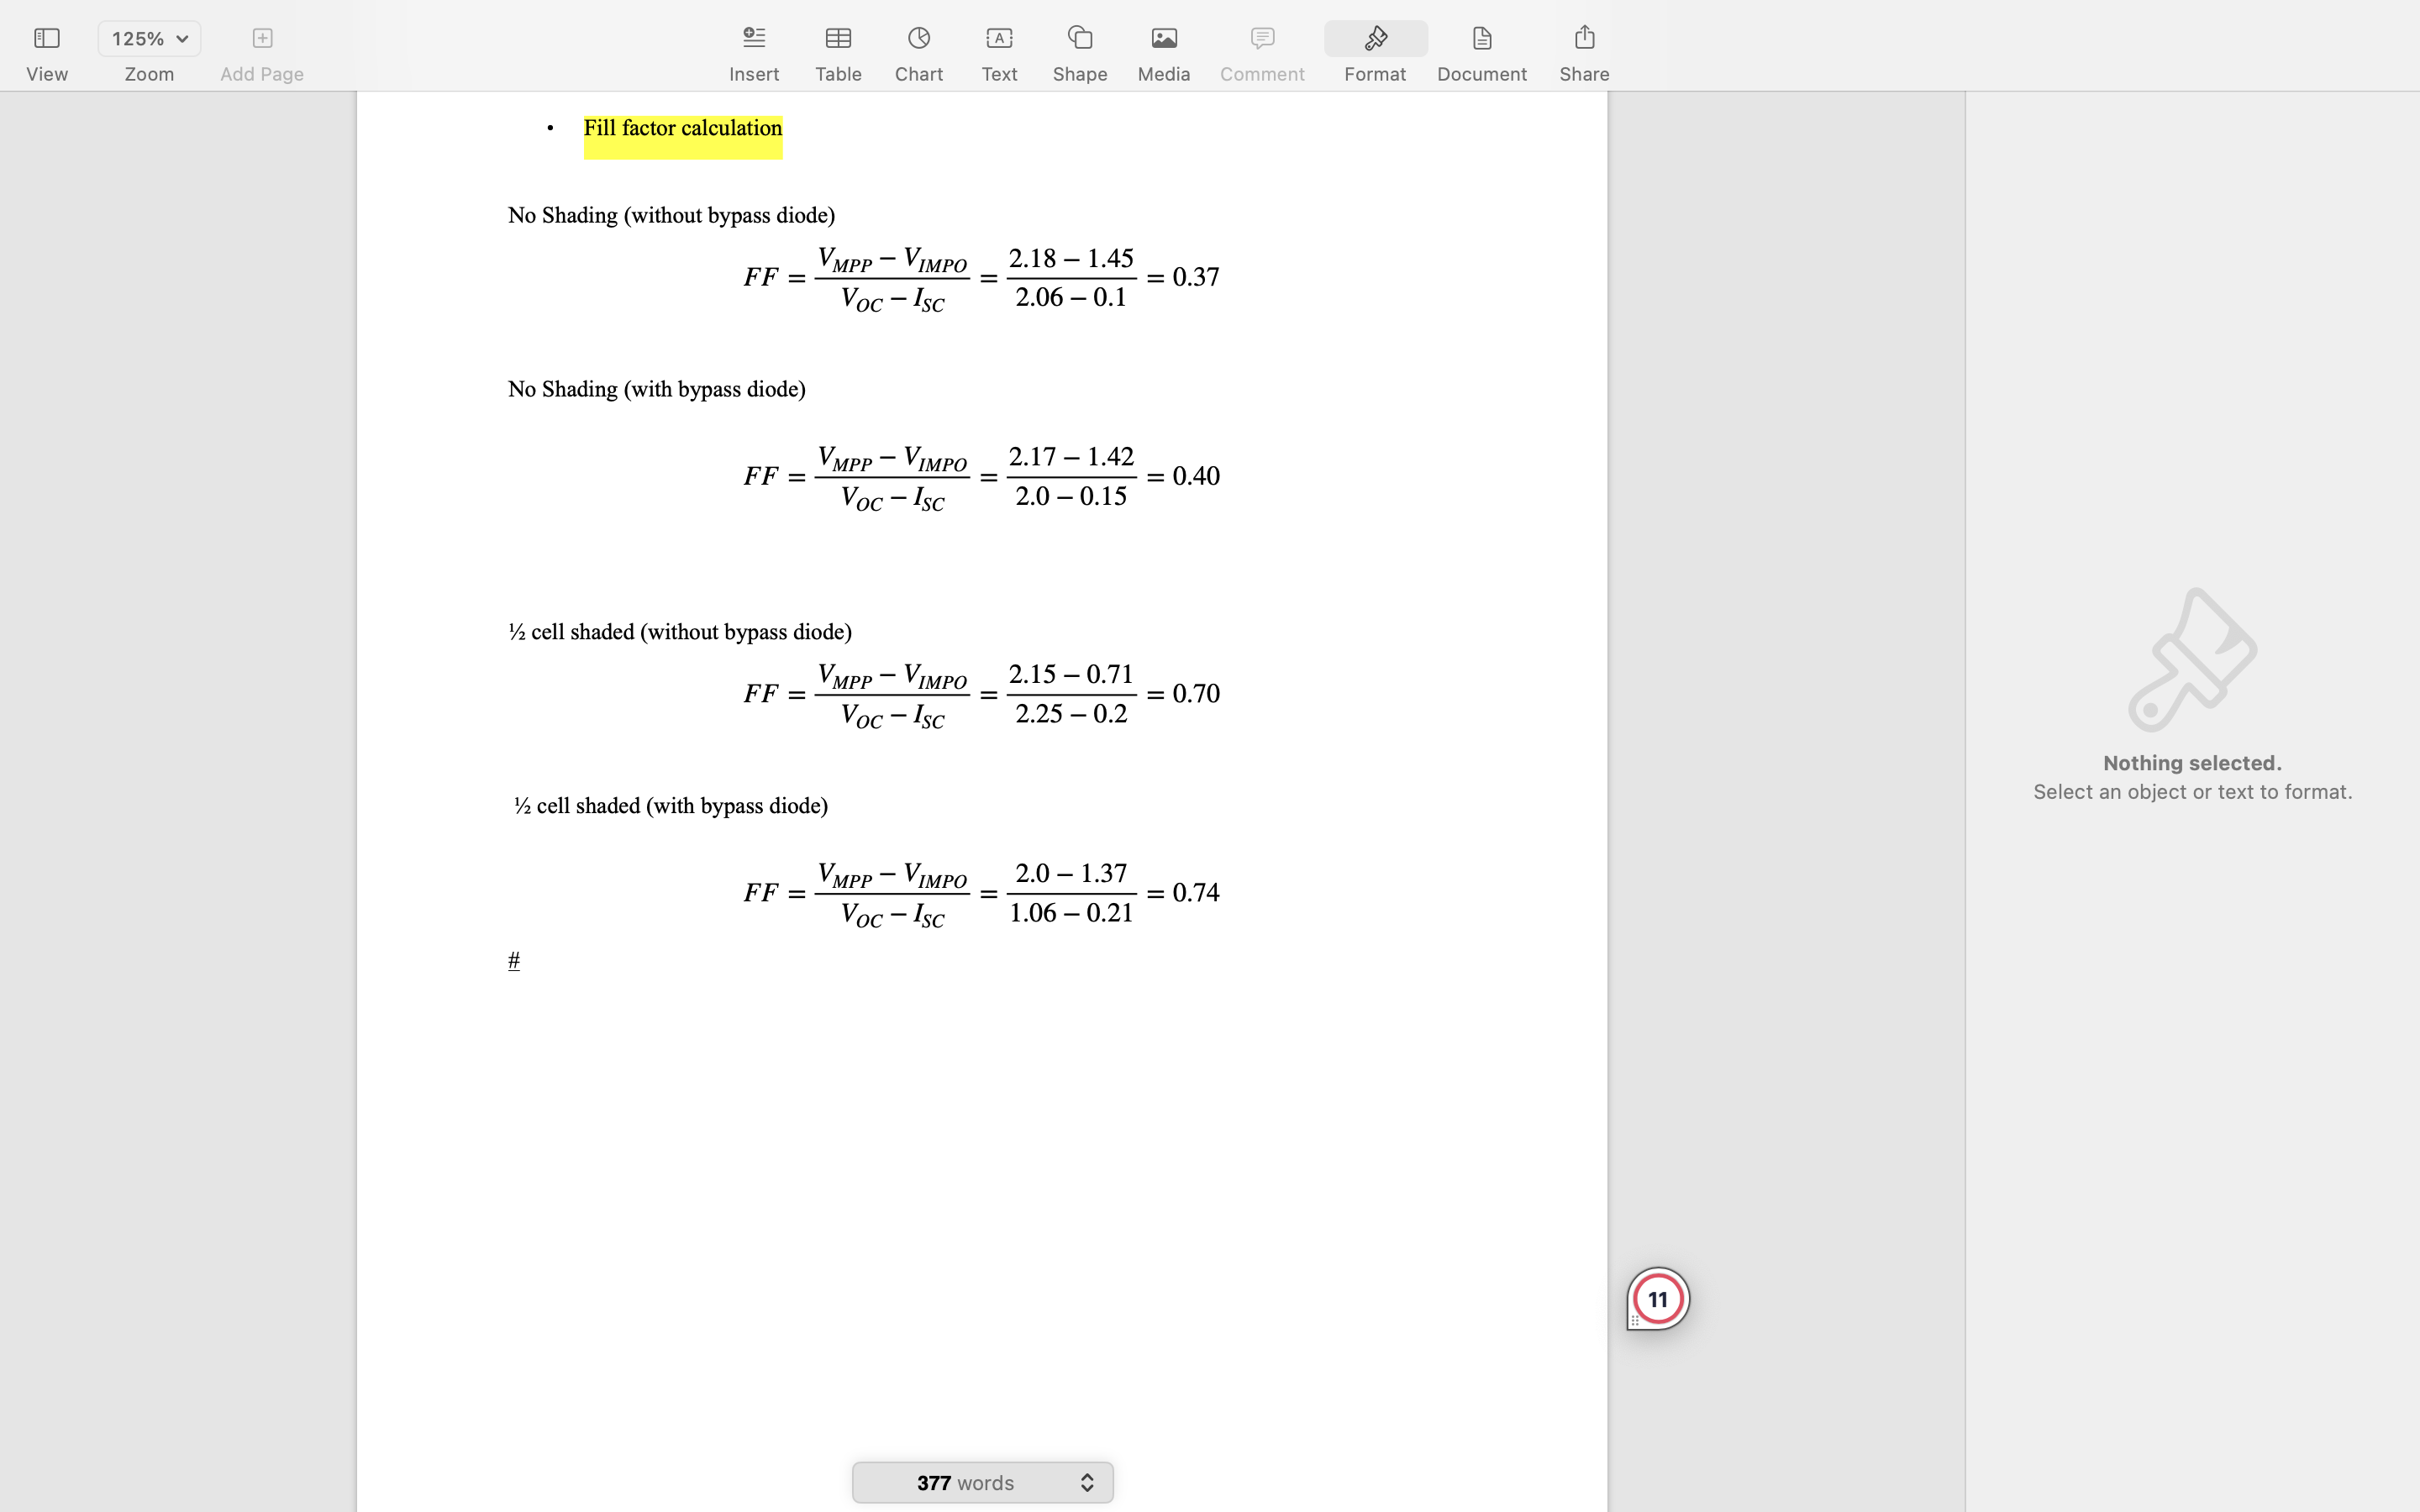


Results Part A TABLE 1: The table below shows data gathered from the experiment using the ET252 software with varying illuminance at constant temperature of 25C Irradiance w/m> 200 400 600 Open-circuit voltage in V | 2.13 2.22 2.24 Short-circuit current in A | 0.84 1.76 1.88 Maximum power in W 1.2 2.04 2.57 Fill factor 0.62 0.23 0.18 % Efficiency at max 60% 51% 42.83% 2 1.8 1.6 1.4 1.2 1 0.8 CURRENT(l) 0.4 0.2 0 2.12 GRAPH OF CURRENT AGAINST VOLTAGE AT VARYING ILLUMINANCE 600 w/m"2 400 w/m\""2 0.6 200w/m"2 2.14 2.16 2.18 2.2 222 2.24 2.26 VOLTAGE(V) Graph 1: The graph above shows the relationship between Current and Voltage (I-V) at varying illuminance level at constant temperature of 25C 377 words S View 125% v Zoom 7 Add Page & o B @ @ 3@ & Insert Table Chart Text Shape Media Comment Format GRAPH OF POWER AGAINST VOLTAGE AT VARYING ILLUMINANCE 600 w/m2 POWER(W) 1 200w/m2 212 214 216 218 22 222 224 VOLTAGE(V) Document Graph 1: The graph above shows the relationship between Power and Voltage (P-V) at varying illuminance level at constant temperature of 25C Part B: Shaded Solar Cells Table 2 : The table below shows data gathered from the experiment using the ET252 software with constant illuminance of 300w/m\" at temperature 25C Shading Level No Shading No Shading Y cell shaded | % cell shaded (without (with bypass (without (with bypass bypass diode) diode) bypass diode) | diode) Open-circuit voltage in | 2.18 217 2.15 2.0 v Short-circuit current in | 1.45 1.42 0.71 1.37 A Maximum power in W [ 1.77 18 1.16 | 12 Fill factor 037 0.40 0.70 0.74 % Efficiency at max 59% 60% 39% 41% power
Step by Step Solution
There are 3 Steps involved in it

Get step-by-step solutions from verified subject matter experts