

Question: Results Table 1. Results for a z-test on the difference in accuracy between the proportion of starved and well-fed Physarum in the Easy and Difficult
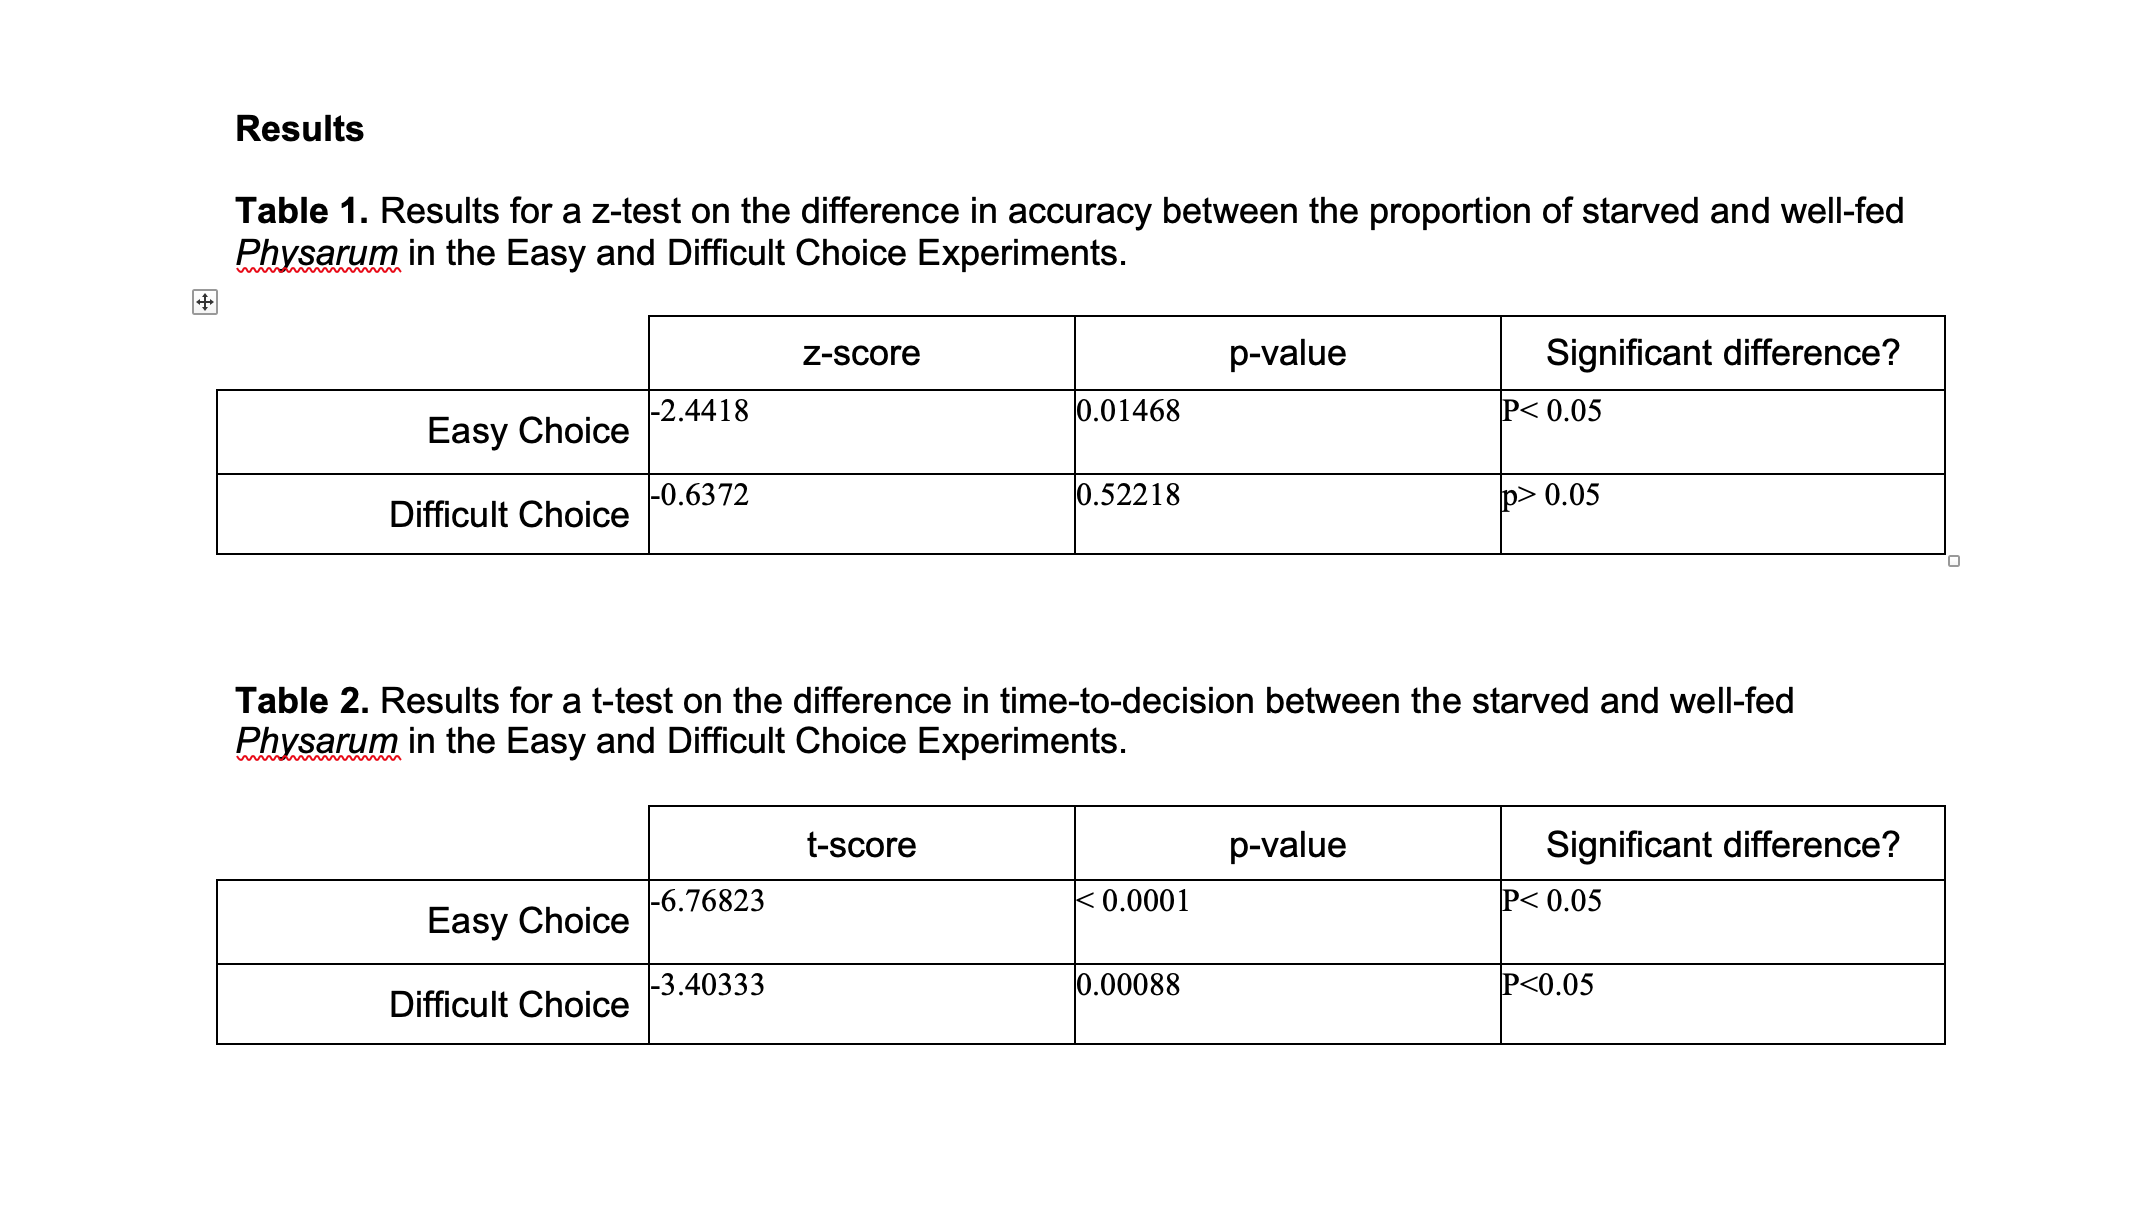
Results Table 1. Results for a z-test on the difference in accuracy between the proportion of starved and well-fed Physarum in the Easy and Difficult Choice Experiments. z-score p-value Significant difference? Easy Choice -2.4418 0.01468 P 0.05 Table 2. Results for a t-test on the difference in time-to-decision between the starved and well-fed Physarum in the Easy and Difficult Choice Experiments. t-score p-value Significant difference? Easy Choice 6.76823 0.0001 P
Step by Step Solution
There are 3 Steps involved in it
1 Expert Approved Answer
Step: 1 Unlock

Question Has Been Solved by an Expert!
Get step-by-step solutions from verified subject matter experts
Step: 2 Unlock
Step: 3 Unlock