

Question: Return IWM Use the data in the range H141:1158 to answer questions 20 to 23 in the highlighted cells in column E using 4-digits accuracy.
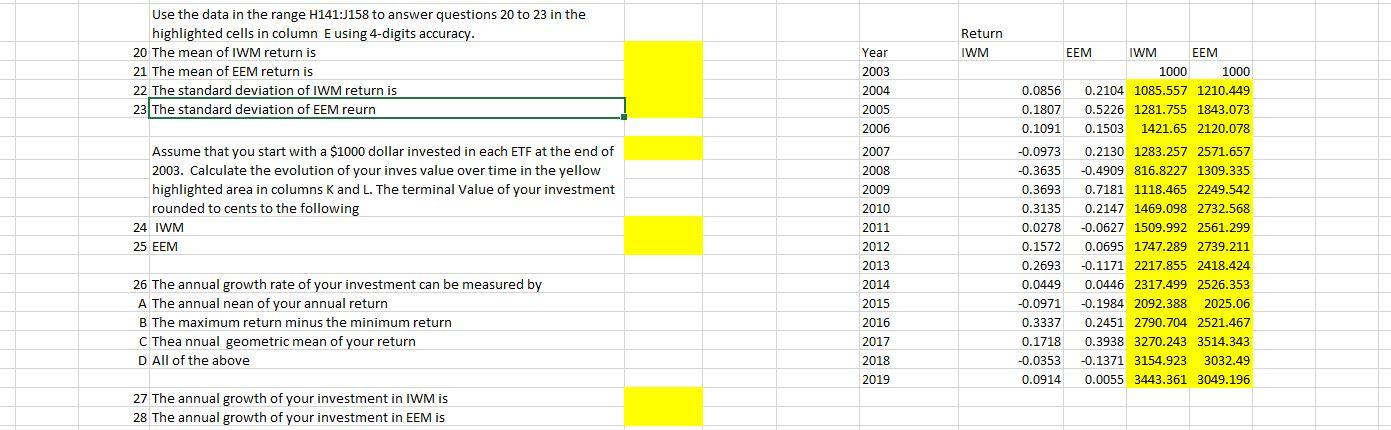
Return IWM Use the data in the range H141:1158 to answer questions 20 to 23 in the highlighted cells in column E using 4-digits accuracy. 20 The mean of IWM return is 21 The mean of EEM return is 22 The standard deviation of IWM return is 23 The standard deviation of EEM reurn Year 2003 2004 2005 2006 Assume that you start with a $1000 dollar invested in each ETF at the end of 2003. Calculate the evolution of your inves value over time in the yellow highlighted area in columns K and L. The terminal Value of your investment rounded to cents to the following 2007 2008 2009 2010 2011 2012 EEM IWM EEM 1000 1000 0.0856 0.2104 1085.557 1210.449 0.1807 0.5226 1281.755 1843.073 0.1091 0.1503 1421.65 2120.078 -0.0973 0.2130 1283.257 2571.657 -0.3635 -0.4909 816.8227 1309.335 0.3693 0.7181 1118.465 2249.542 0.3135 0.2147 1469.098 2732.568 0.0278 -0.0627 1509.992 2561.299 0.1572 0.0695 1747.289 2739.211 0.2693 -0.1171 2217.855 2418.424 0.0449 0.0446 2317.499 2526.353 -0.0971 -0.1984 2092.388 2025.06 0.3337 0.2451 2790.704 2521.467 0.1718 0.3938 3270.243 3514.343 -0.0353 -0.1371 3154.923 3032.49 0.0914 0.0055 3443.361 3049.196 24 IWM 25 EEM 2013 26 The annual growth rate of your investment can be measured by A The annual nean of your annual return B The maximum return minus the minimum return C Thea nnual geometric mean of your return D All of the above 2014 2015 2016 2017 2018 2019 27 The annual growth of your investment in IWM is 28 The annual growth of your investment in EEM IS Return IWM Use the data in the range H141:1158 to answer questions 20 to 23 in the highlighted cells in column E using 4-digits accuracy. 20 The mean of IWM return is 21 The mean of EEM return is 22 The standard deviation of IWM return is 23 The standard deviation of EEM reurn Year 2003 2004 2005 2006 Assume that you start with a $1000 dollar invested in each ETF at the end of 2003. Calculate the evolution of your inves value over time in the yellow highlighted area in columns K and L. The terminal Value of your investment rounded to cents to the following 2007 2008 2009 2010 2011 2012 EEM IWM EEM 1000 1000 0.0856 0.2104 1085.557 1210.449 0.1807 0.5226 1281.755 1843.073 0.1091 0.1503 1421.65 2120.078 -0.0973 0.2130 1283.257 2571.657 -0.3635 -0.4909 816.8227 1309.335 0.3693 0.7181 1118.465 2249.542 0.3135 0.2147 1469.098 2732.568 0.0278 -0.0627 1509.992 2561.299 0.1572 0.0695 1747.289 2739.211 0.2693 -0.1171 2217.855 2418.424 0.0449 0.0446 2317.499 2526.353 -0.0971 -0.1984 2092.388 2025.06 0.3337 0.2451 2790.704 2521.467 0.1718 0.3938 3270.243 3514.343 -0.0353 -0.1371 3154.923 3032.49 0.0914 0.0055 3443.361 3049.196 24 IWM 25 EEM 2013 26 The annual growth rate of your investment can be measured by A The annual nean of your annual return B The maximum return minus the minimum return C Thea nnual geometric mean of your return D All of the above 2014 2015 2016 2017 2018 2019 27 The annual growth of your investment in IWM is 28 The annual growth of your investment in EEM IS
Step by Step Solution
There are 3 Steps involved in it

Get step-by-step solutions from verified subject matter experts