

Question: Return Next 9 1 point Below we have the population change for US counties over the period 2000 to 2017, compared to the median household
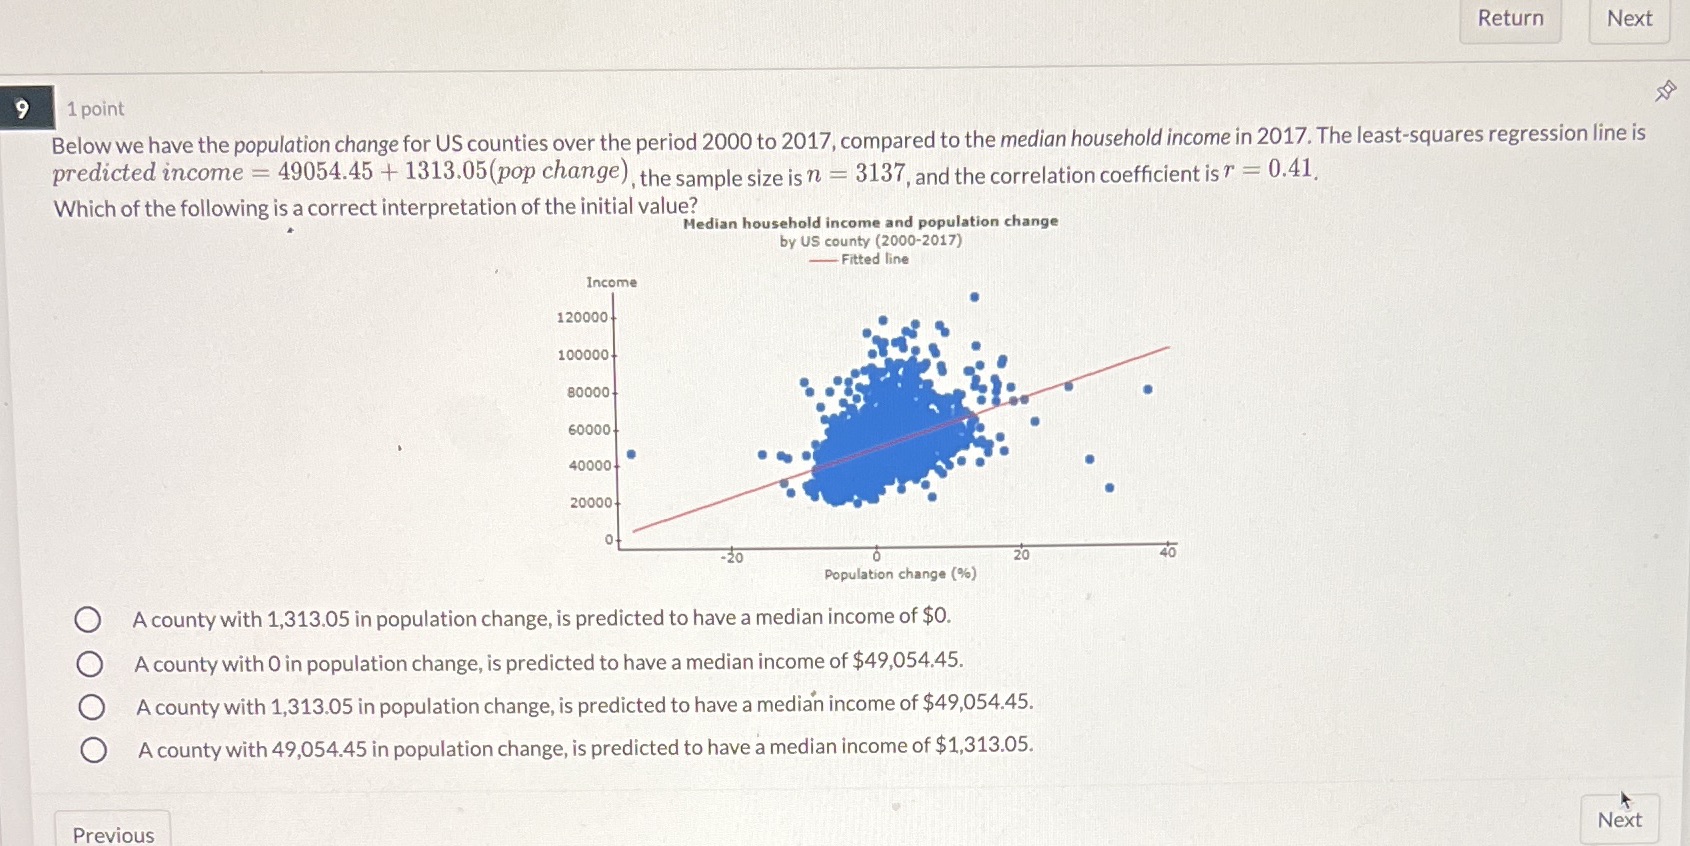
Return Next 9 1 point Below we have the population change for US counties over the period 2000 to 2017, compared to the median household income in 2017. The least-squares regression line is predicted income = 49054.45 + 1313.05(pop change), the sample size is n - 3137, and the correlation coefficient is ? = 0.41, Which of the following is a correct interpretation of the initial value? Median household income and population change by US county (2000-2017) Fitted line Income 120000 100000 80000 60000 40000 20000 -20 20 40 Population change (%) A county with 1,313.05 in population change, is predicted to have a median income of $0. O A county with O in population change, is predicted to have a median income of $49,054.45. O A county with 1,313.05 in population change, is predicted to have a median income of $49,054.45. O A county with 49,054.45 in population change, is predicted to have a median income of $1,313.05. Previous Next
Step by Step Solution
There are 3 Steps involved in it

Get step-by-step solutions from verified subject matter experts