

Question: Returns Statistics Average Std. dev. Correlation coefficient KO MSFT 8.86% 18.36% 14.12% 27.19% 0.62 T-bill 1.18% 1.50% Investment Opportunity Set Portfolio Weights KO-MSFT Portfolio Statistics
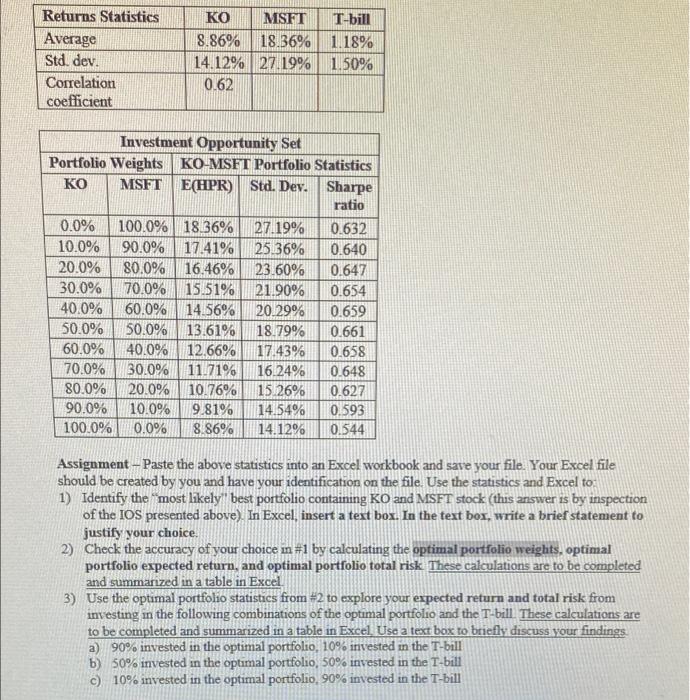
Returns Statistics Average Std. dev. Correlation coefficient KO MSFT 8.86% 18.36% 14.12% 27.19% 0.62 T-bill 1.18% 1.50% Investment Opportunity Set Portfolio Weights KO-MSFT Portfolio Statistics KO MSFT E(HPR) Std. Dev. Sharpe ratio 0.0% 100.0% 18 36% 27.19% 0.632 10.0% 90.0% 17.41% 25.36% 0.640 20.0% 80.0% 16.46% 23.60% 0.647 30.0% 70.0% 15.51% 21.90% 0.654 40.0% 60.0% 14.56% 20.29% 0.659 50.0% 50.0% 13.61% 18.79% 0.661 60.0% 40.0% 12.66% 17.43% 0.658 70.0% 30.0% 11.71% 16.24% 0.648 80.0% 20.0% 10.76% 15.26% 0.627 90.0% 10.0% 9.81% 14,54% 0.593 100.0% 0.0% 8.86% 14.12% 0.544 - Assignment - Paste the above statistics into an Excel workbook and save your file. Your Excel file should be created by you and have your identification on the file. Use the statistics and Excel to 1) Identify the most likely'' best portfolio containing KO and MSFT stock (thus answer is by inspection of the IOS presented above). In Excel, insert a text box. In the text box, write a brief statement to justify your choice 2) Check the accuracy of your choice in #1 by calculating the optimal portfolio weights, optimal portfolio expected return, and optimal portfolio total risk. These calculations are to be completed and summarized in a table in Excel 3) Use the optimal portfolio statistics from #2 to explore your expected return and total risk from investing in the following combinations of the optimal portfolio and the T-bill These calculations are to be completed and summarized in a table in Excel. Use a text box to briefly discuss your findings a) 90% invested in the optimal portfolio, 10% invested in the T-bill b) 50% invested in the optimal portfolio, 50% invested in the T-bill c) 10% invested in the optimal portfolio, 90% invested in the T-bill Returns Statistics Average Std. dev. Correlation coefficient KO MSFT 8.86% 18.36% 14.12% 27.19% 0.62 T-bill 1.18% 1.50% Investment Opportunity Set Portfolio Weights KO-MSFT Portfolio Statistics KO MSFT E(HPR) Std. Dev. Sharpe ratio 0.0% 100.0% 18 36% 27.19% 0.632 10.0% 90.0% 17.41% 25.36% 0.640 20.0% 80.0% 16.46% 23.60% 0.647 30.0% 70.0% 15.51% 21.90% 0.654 40.0% 60.0% 14.56% 20.29% 0.659 50.0% 50.0% 13.61% 18.79% 0.661 60.0% 40.0% 12.66% 17.43% 0.658 70.0% 30.0% 11.71% 16.24% 0.648 80.0% 20.0% 10.76% 15.26% 0.627 90.0% 10.0% 9.81% 14,54% 0.593 100.0% 0.0% 8.86% 14.12% 0.544 - Assignment - Paste the above statistics into an Excel workbook and save your file. Your Excel file should be created by you and have your identification on the file. Use the statistics and Excel to 1) Identify the most likely'' best portfolio containing KO and MSFT stock (thus answer is by inspection of the IOS presented above). In Excel, insert a text box. In the text box, write a brief statement to justify your choice 2) Check the accuracy of your choice in #1 by calculating the optimal portfolio weights, optimal portfolio expected return, and optimal portfolio total risk. These calculations are to be completed and summarized in a table in Excel 3) Use the optimal portfolio statistics from #2 to explore your expected return and total risk from investing in the following combinations of the optimal portfolio and the T-bill These calculations are to be completed and summarized in a table in Excel. Use a text box to briefly discuss your findings a) 90% invested in the optimal portfolio, 10% invested in the T-bill b) 50% invested in the optimal portfolio, 50% invested in the T-bill c) 10% invested in the optimal portfolio, 90% invested in the T-bill
Step by Step Solution
There are 3 Steps involved in it

Get step-by-step solutions from verified subject matter experts