

Question: Revenue and expense data for the current calendar year for Sorenson Electronics Company and for the electronics industry are as follows. The Sorenson Electronics Company
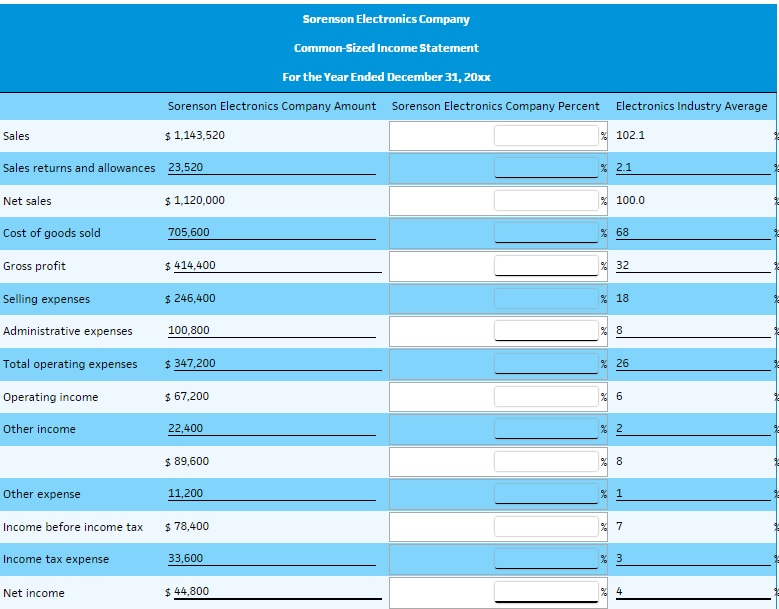
Revenue and expense data for the current calendar year for Sorenson Electronics Company and for the electronics industry are as follows. The Sorenson Electronics Company data are expressed in dollars. The electronics industry averages are expressed in percentages.
| Sorenson Electronics Company | Electronics Industry Average | ||||
| Sales | $1,143,520 | 102.1 | % | ||
| Sales returns and allowances | 23,520 | 2.1 | |||
| Net sales | $1,120,000 | 100 | % | ||
| Cost of goods sold | 705,600 | 68 | |||
| Gross profit | $414,400 | 32 | % | ||
| Selling expenses | $246,400 | 18 | % | ||
| Administrative expenses | 100,800 | 8 | |||
| Total operating expenses | $347,200 | 26 | % | ||
| Operating income | $67,200 | 6 | % | ||
| Other income | 22,400 | 2 | |||
| $89,600 | 8 | % | |||
| Other expense | 11,200 | 1 | |||
| Income before income tax | $78,400 | 7 | % | ||
| Income tax expense | 33,600 | 3 | |||
| Net income | $44,800 | 4 | % Prepare a common-sized income statement comparing the results of operations for Sorenson Electronics Company with the industry average. If required, round percentages to one decimal place. Enter all amounts as positive numbers.
| ||
Step by Step Solution
There are 3 Steps involved in it
1 Expert Approved Answer
Step: 1 Unlock

Question Has Been Solved by an Expert!
Get step-by-step solutions from verified subject matter experts
Step: 2 Unlock
Step: 3 Unlock