

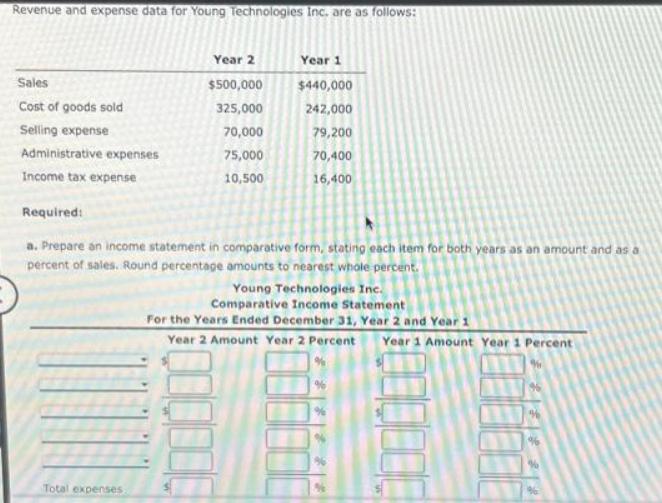
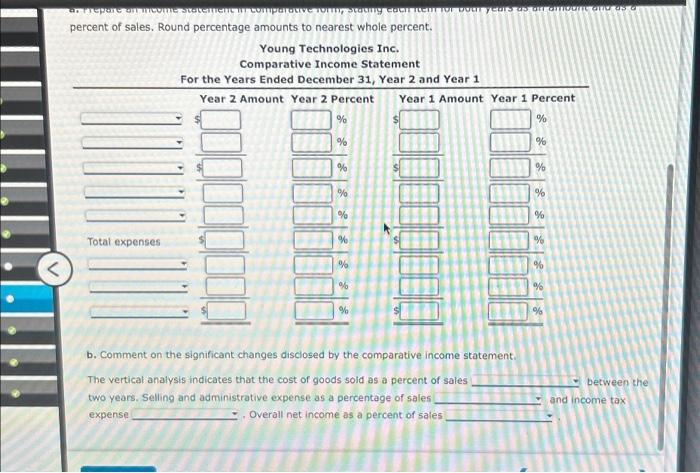
Revenue and expense data for Young Technologies Inc. are as follows: Sales Cost of goods sold...
Fantastic news! We've Found the answer you've been seeking!
Question:
Expert Answer:
a Comparative Income Statement Year 2 Year 1 Sales 500000 440000 Cost of Goods Sold 325000 242000 Gr... View the full answer

Related Book For 
Financial Reporting Financial Statement Analysis and Valuation
ISBN: 978-0324302950
6th edition
Authors: Clyde P. Stickney
Posted Date:
