Question: REVERSE FINANCIAL ANALYSIS Organizations that operate in the same industry have similar corporate and financial decisions, leading to similar financial characteristics. With some knowledge of
REVERSE FINANCIAL ANALYSIS
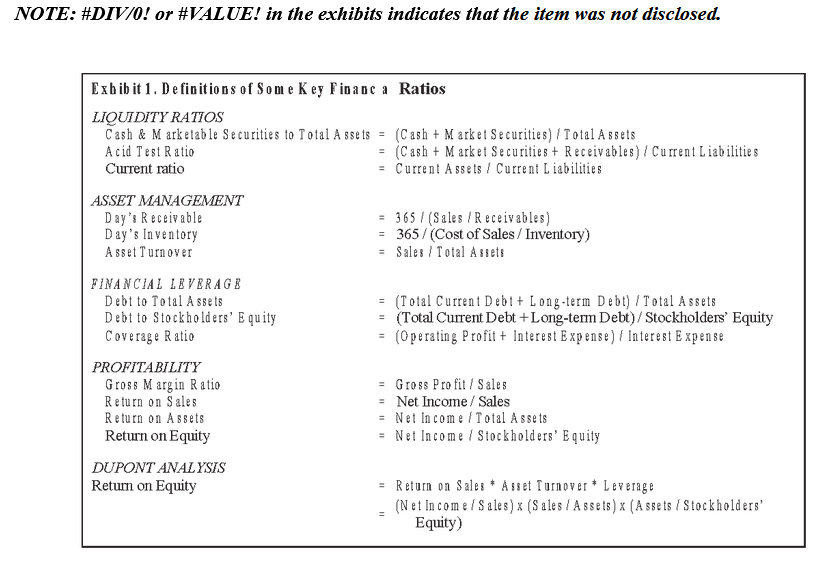
Organizations that operate in the same industry have similar corporate and financial decisions, leading to similar financial characteristics. With some knowledge of the different operating, investing, and financing decisions across industries, financial ratios may be used to identify an industry (see Exhibit 1 for the definition of ratios used).
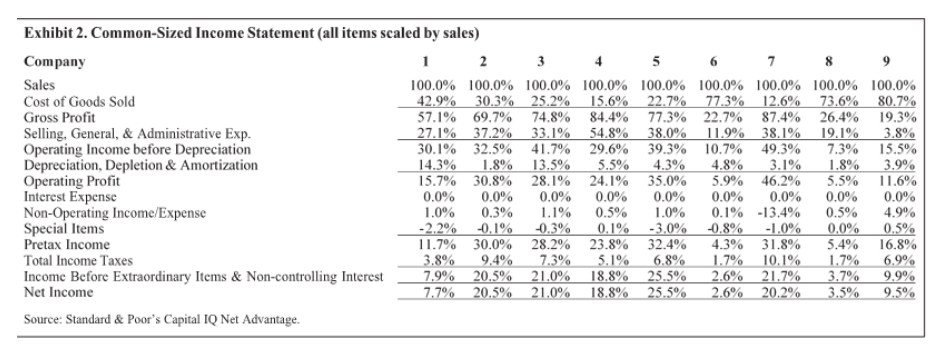
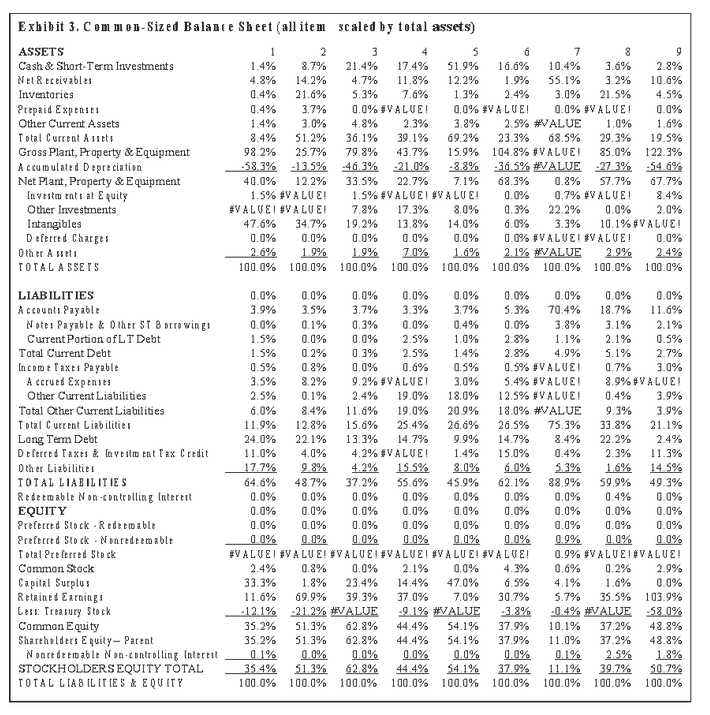
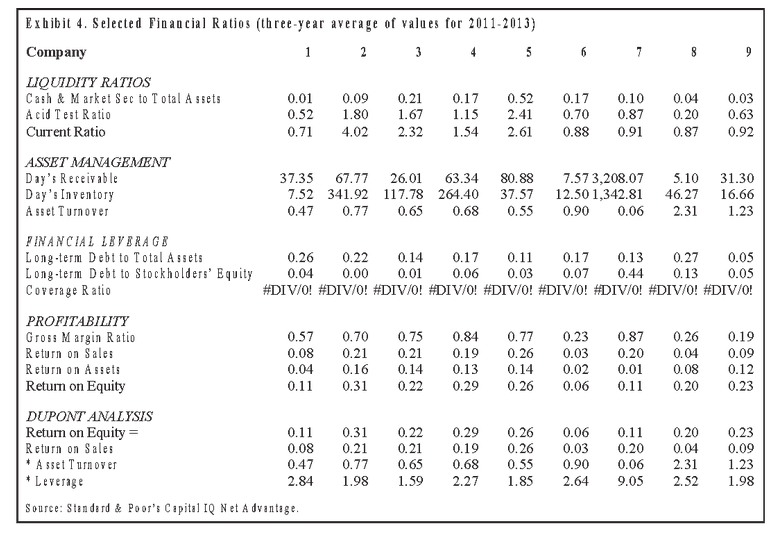
In this problem, using the financial statement data provided in Exhibits 2, 3, and 4, you are required to match the companies with their industry. Use the EXCEL template png18, png19, png20 provided to answer the problem. The list of industries is provided below.
The list of industries is as below:
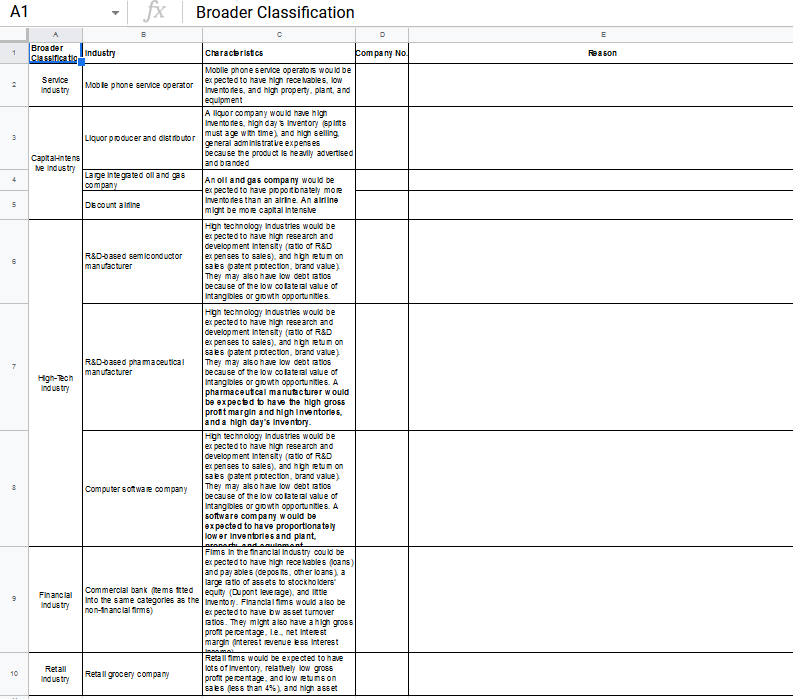
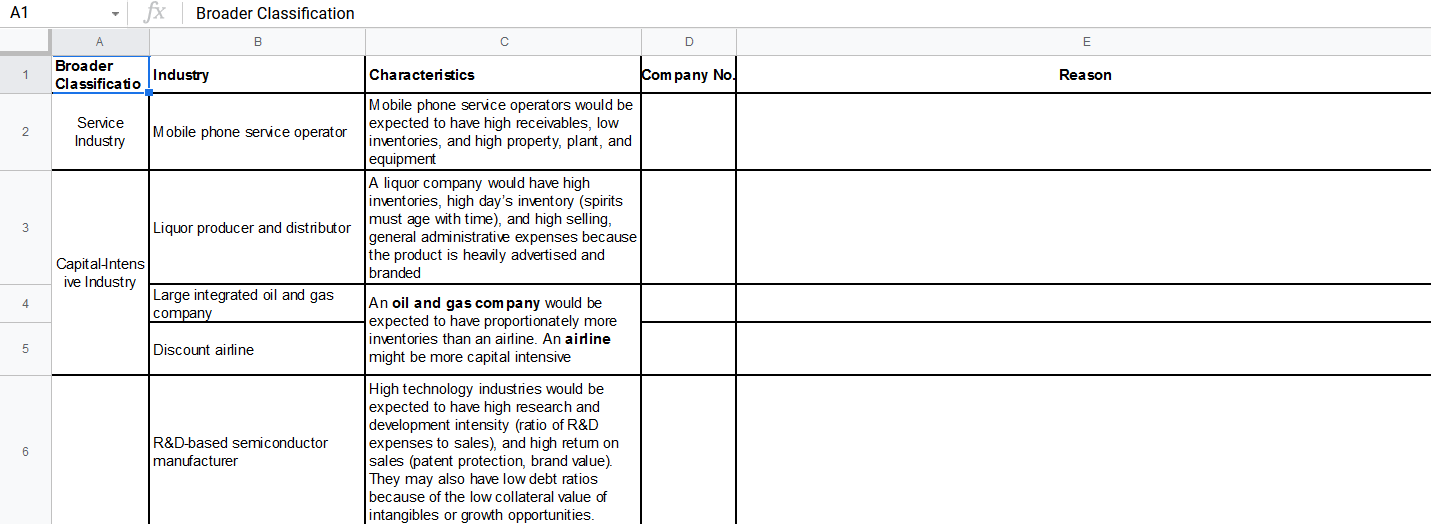
? Liquor producer and distributor
? Discount airline
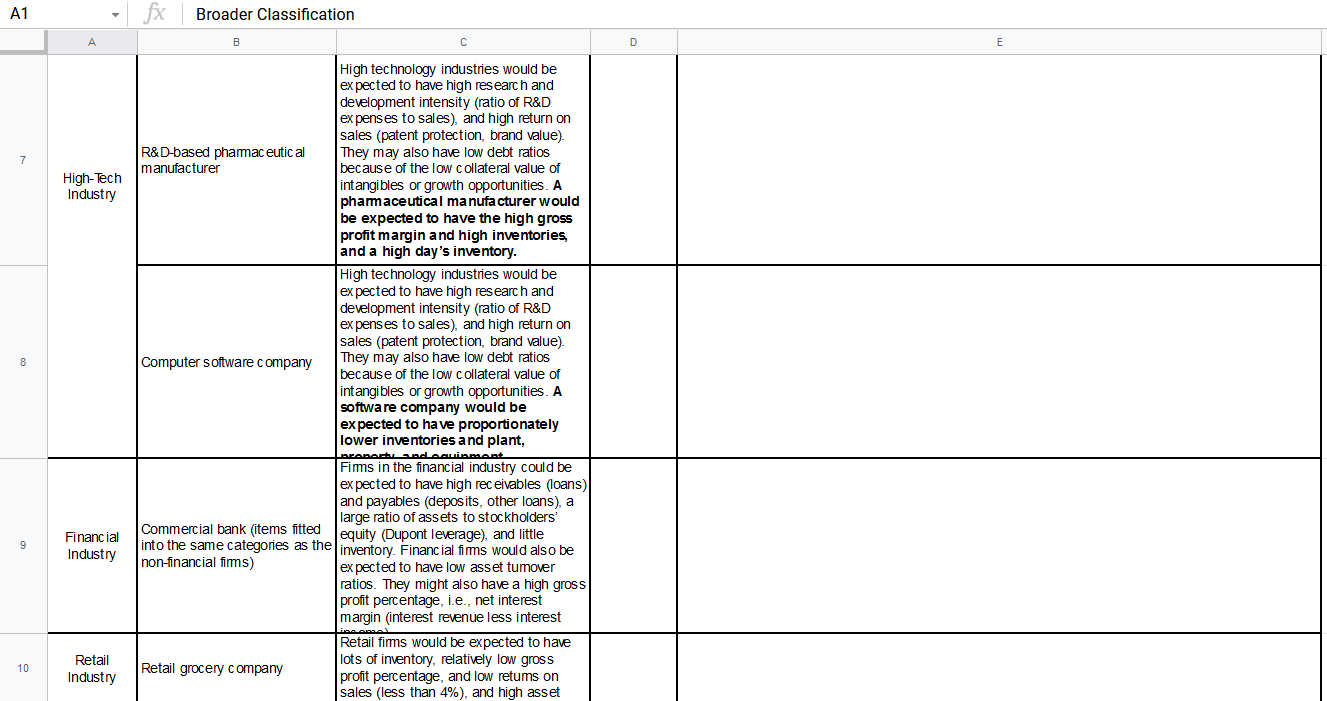
? Commercial bank (items fitted into the same categories as the non-financial firms)
? Computer software company
? Large integrated oil and gas company
? Mobile phone service operator
? R&D-based pharmaceutical manufacturer
? Retail grocery company
? R&D-based semiconductor manufacturer
Details about the EXCEL template
The template provided to you has 5 columns. The first column is the broader classification of industries such as Retail, Financial, High-Tech etc. The second column is the same list of industries as provided above. The third column describes the financial characteristics of these industries. These characteristics should help you in matching the companies to the industries. You are free to do some additional research, if required, on the specific industry to understand its financial characteristics.
You need to fill columns 4 (Company No.) and column 5 (Reason). The reason should clearly articulate why did you match a specific company to a specific industry, focussing on the ratios and other data provided to you. Accurate reason and an accurate should be matched together.
NOTE: #DIV/0! or #VALUE! in the exhibits indicates that the item was not disclosed.
NOTE: #DIV/0! or #VALUE! in the exhibits indicates that the item was not disclosed. Exhibit 1. Definitions of Some Key Financa Ratios LIQUIDITY RATIOS Cash & Marketable Securities to Total Assets = (Cash + Market Securities) / Total Assets Acid Test Ratio = (Cash + Market Securities + Receivables) / Current Liabilities Current ratio = Current Assets / Current Liabilities ASSET MANAGEMENT Day's Receivable = 365 / (Sales /Receivables) Day's Inventory = 365 / (Cost of Sales / Inventory) Asset Turnover = Sales / Total Assets FINANCIAL LEVERAGE Debt to Total Assets = (Total Current Debi+ Long-term Debt) / Total Assets Debt to Stockholders' Equity = (Total Current Debt + Long-term Debt) / Stockholders Equity Coverage Ratio = (Operating Profit + Interest Expense) / Interest Expense PROFITABILITY Gross Margin Ratio Gross Profit / Sales Return on Sales Net Income / Sales Return on Assets Net Income / Total Assets Return on Equity = Net Income / Stockholders' Equity DUPONT ANALYSIS Return on Equity = Return on Sales * Asset Turnover * Leverage (Net Income / Sales ) x (Sales / Assets) x (Assets / Stockholders' Equity)Exhibit 2. Common-Sized Income Statement (all items scaled by sales) N Company 3 5 6 7 8 9 Sales 100.0% 100.0% 100.0% 100.0% 100.0% 100.0% 100.0% 100.0% 100.0% Cost of Goods Sold 42.9% 30.3% 25.2% 15.6% 22.7% 77.3% 12.6% 73.6% 80.7% Gross Profit 57.1% 69.7% 74.8% 84.4% 77.3% 22.7% 87.4% 26.4% 19.3% Selling, General, & Administrative Exp. 27.1% 37.2% 33.1% 54.8% 38.0% 11.9% 38.1% 19.1% 3.8% Operating Income before Depreciation 30.1% 32.5% 41.7% 29.6% 39.3% 10.7% 49.3% 7.3% 15.5% Depreciation, Depletion & Amortization 14.3% 1.8% 13.5% 5.5% 4.3% 4.8% 3.1% 1.8% 3.9% Operating Profit 15.7% 30.8% 28.1% 24.1% 35.0% 5.9% 46.2% 5.5% 1 1.6% Interest Expense 0.0% 0.0% 0.0% 0.0% 0.0% 0.0% 0.0% 0.0% 0.0% Non-Operating Income/Expense 1.0% 0.3% 1.1% 0.5% 1.0% 0.1% -13.4% 0.5% 4.9% Special Items -2.2% -0.1% -0.3% 0.1% -3.0% -0.8% -1.0% 0.0% 0.5% Pretax Income 11.7% 30.0% 28.2% 23.8% 32.4% 4.3% 31.8% 5.4% 16.8% Total Income Taxes 3.8% 9.4% 7.3% 5.1% 6.8% 1.7% 10.1% 1.7% 6.9% Income Before Extraordinary Items & Non-controlling Interest 7.9% 20.5% 21.0% 18.8% 25.5% 2.6% 21.7% 3.7% 9.9% Net Income 7.7% 20.5% 21.0% 18.8% 25.5% 2.6% 20.2% 3.5% 9.5% Source: Standard & Poor's Capital IQ Net Advantage.Exhibit 3. Common-Sized Balance Sheet (all item scaled by total assets) 9 ASSETS 1 2 3 2.8% Cash & Short-Term Investments 1.4% 2.7% 21.4% 17.4% 51.9% 16.6% 10.4% 3.6% 4.8% 14.2% 4.7% 11.8% 12.2% 1.9% 55.1% 3.2% 10.6% Net Receivables 21.6% 5.3% 7.0% 1.3% 2.4% 3.0% 21.5% 4.5% Inventories 0.4% 0.4% 3.7% 0.0% #VALUE! 0.0% #VALUE! 0.0% #VALUE! 0.0% Prepaid Expenses 1.0% 1.6% Other Current Assets 1.4% 3.0% 4.3% 2.3% 3.8% 2.5% #VALUE 8.4% 51.2% 36.1% 39.1% 69.2% 23.3% 68.5% 29.3% 19.5% Total Current Assets 98.2% 25.7% 79.3% 43.7% 15.9% 104.8% #VALUE! 85.0% 122.3% Gross Plant, Property & Equipment -58.3% -13.5% -46.3% -210% -8.3% 36.5% #VALUE -27.3% -54.6% Accumulated Depreciation 33.5% 22.7% 7.1% 0.3% 57.7% Net Plant, Property & Equipment 40.0% 12.2% 68.3% 67.7% 1.5% #VALUE! 1.5% #VALUE! #VALUE! 0.0% 0.7% #VALUE! 3.4% In veston ents at Equity 7.3% 17.3% 8,0% 22.2% 0.0% 2.0% Other Investments #VALUEISVALUEI 19.2% 13.8% 14.0% 6.0% 3.3% 10.1% #VALUE! Intangibles 47.6% 34.7% 0.0% 1.0% #VALUE!VALUE! 0.0% 0.0% Deferred Charges 0.0% 0.0% 0.0% 2.9% 2.4% Other A meets 2.6% 1.9% 1.9% 70% 10% 2.1% #VALUE 100.0% 100.0% 100.0% 100.0% 100.0% 100.0% 100.1% 100.0% 100.0% TOTAL ASSETS 0.0% 0.1% 0.0% 0.0% 0.0% 0.0% 0.0% 0.0% 0.0% LIABILITIES 70.4% 18.7% 11.6% Accounts Payable 3.9% 3.5% 3.7% 3.3% 3.7% 5.3% 0.0% 0.1% 1.3% 0.0% 0.4% 0.0% 3.8% 3.1% 2.1% Notes Payable & Other ST 8 prrowing: 2.5% 2.8 1.1% 2.1% 0.5% Current Portion ofLT Debt 1.5% 0.1% 1.0% 2.5% 1.4% 2.8% 4.9% 5.1% 2.7% Total Current Debt 1.5% 0.2% 1.3% 1.5% #VALUE! 0.7% 3.0% Income Taxes Payable 0.5% 0.8% 1.0% 0.6% 0.5% 3.5% 3.2% 9.2% #VALUEI 3.0% 5.4% #VALUE 2.9% #VALUE! A ccrued Expenses 0.4% 3.9% Other Current Liabilities 2.5% 0.1% 2.4% 19.0% 18.0% 12.5% #VALUE! 3.4% 11.6% 19.0% 20.9% 18.0% #VALUE 9.3% 3.9% Total Other Current Liabilities 6.0% 15.0% 25.4% 26.0% 26.5% 75.3% 33.8% 21.1% Total Current Liabilities 11.9% 12.8% 22.2% 2.4% Long Term Debt 24.0% 22.1% 13.3% 14.7% 9.9% 14.7% 2.4% 1.4% 15.0% 0.4% 2.3% 11.3% Deferred Taxes & Investment Tax Credit 1 1.0% 4.1% 4.2% #VALUE! 17.7% 9.8% 4.2% 15.5% 8.0% 6.0% 5.3% 1.6% 14.5% Other Liabilities 64.6% 48.7% 37.2% 55.6% 45.9% 62.1% 38.9% 59.9% 49.3% TOTAL LIABILITIES Redeemable Non-controlling Interest 0.0% 0.0% 0.0% 0.0% 0.0% 0.0% 0.0% 0.4% 0.0% 0.0% 0.0% 0.0% 0.0% 0.0% 0.0% 0.0% 1.0% 0.0% EQUITY 0.1% 1.0% 1.0% 1.0% 1.0% 0.1% 1.0% 0.0% Preferred Stock - Redeemable 0.0% 0.0% Preferred Stock . Nonredeemable 1.0% 0.0% 0.0% 1.0% 0.0% 0.0% 0.9% 0.0% #VALUE! #VALUE! VALUE! VALVE! VALUE! VALUE! 0.9% #VALUEISVALUE! Total Preferred Stock 0.0% 2.1% 0,0% 4.376 0,6% 1.2% 2.9% Common Stock 2.4% 0.3% 33.3% 1.8% 23.4% 14.4% 47.0% 6.5% 4.1% 1.6% 0.0% Capital Surplus 11.6% 19.9% 39.3% 37.0% 7.0% 30.7% 5.7% 35.5% 103.9% Retained Earnings Less Treasury Stock -12.1% -21.2% #VALUE -9 1% #VALUE 313% -0.4% #VALUE -53 0% 35.2% 51.3% 62.1% 44.4% 54.1% 37.9% 10.1% 37.2% 48.8% Common Equity 44.4% 54.1% 37.9% 11.0% 37.2% 48.8% Shareholders Equity- Parent 35.2% $1.3% 62.3% 0.1% 0.0% 0.0% 1.0% 0.0% 1.0% 0.1% 2.5% 1.8% Nonredeemable Non-controlling Interest 35.4% 62.3% 44.4% 54.1% 37.9%% 11 1% 39.7% 50.7% STOCKHOLDERS EQUITY TOTAL 100.0% 100.0% 100.0% 100.0% 100.0% 100.0% 100.0% 100.0% 100.0% TOTAL LIABILITIES & EQUITYExhibit 4. Selected Financial Ratios (three- year average of values for 2011-2013) Company 2 5 7 8 LIQUIDITY RATIOS Cash & Market Sec to Total Assets 0.01 0.09 0.21 0.17 0.52 0.17 0.10 0.04 0.03 Acid Test Ratio 0.52 1.80 1.67 1.15 2.41 0.70 0.87 0.20 0.63 Current Ratio 0.71 4.02 2.32 1.54 2.61 0.88 0.91 0.87 0.92 ASSET MANAGEMENT Day's Receivable 37.35 67.77 26.01 63.34 80.88 7.57 3,208.07 5.10 31.30 Day's Inventory 7.52 341.92 117.78 264.40 37.57 12.50 1,342.81 46.27 16.66 Asset Turnover 0.47 0.77 0.65 0.68 0.55 0.90 0.06 2.31 1.23 FINANCIAL LEVERAGE Long-term Debt to Total Assets 0.26 0.22 0.14 0.17 0.11 0.17 0.13 0.27 0.05 Long-term Debt to Stockholders' Equity 0.04 0.00 0. 01 0.06 0.03 0.07 0.44 0.13 0.05 Coverage Ratio #DIV/O! #DIV/O! #DIV/O! #DIV/O! #DIV/O! #DIV/O! #DIV/O! #DIV/O! #DIV/O! PROFITABILITY Gross Margin Ratio 0.57 0.70 0.75 0.84 0.77 0.23 0.87 0.26 0.19 Return on Sales 0.08 0.21 0.21 0.19 0.26 0.03 0.20 0.04 0.09 Return on Assets 0.04 0.16 0.14 0.13 0. 14 0.02 0.01 0.08 0.12 Return on Equity 0.11 0.31 0.22 0.29 0.26 0.06 0.11 0.20 0.23 DUPONT ANALYSIS Return on Equity = 0.11 0.31 0.22 0.29 0.26 0.06 0.11 0.20 0.23 Return on Sales 0.08 0.21 0.21 0.19 0.26 0.03 0.20 0.04 0.09 * Asset Turnover 0.47 0.77 0. 65 0.68 0.55 0.90 0.06 2.31 1.23 * Leverage 2.84 1.98 1.59 2.27 1.85 2.64 9.05 2.52 1.98 Source: Standard & Poor's Capital IQ Net Advantage.A1 JX Broader Classification D Broader Industry Reason Classificato Characteristics Company No. Mobile phone service operators would be Service Industry Mobile phone service operator ex pected to have high receivables, low nentones, and high property. plant, and equipment A liquor company would have high Inventories, high day's Inventory (spirits Liquor producer and distributor must age with time), and high selling general administrative expenses Capitalntens be cause the product Is heavily advertised I've Industry and branded Large Integrated oll and gale company An oll and gas company would be ex pected to have proportionately mole Discount aliline inventories than an alrine. An alrillne might be more capital Intensive High technology Industries would be expected to have high research and development Intensity (atlo of RED RED-based semiconductor ex penses to sales), and high letum on manufacturer sales (patent protection, brand value) They may also have low debt atlos because of the low collateral value of Intangibles or growth opportunities High technology Industries would be ex pected to have high research and development Intensity (atlo of RED ex penses to sales), and high return on sales (patent protection, brand value) RED-based pharmaceutical They may also have low debt atlos manufacturer because of the low colateral value of High-Tech hanglbles or growth opportunities. A Industry pharmaceutical manufacturer would be expected to have the high gross profit margin and high Inventories. and a high day's Inventory. High technology Industries would be ex pected to have high research and development Intensity (atlo of RED ex penses to sales), and high letum on sales (patent protection, brand value) Computer software company They may also have low debt ratios because of the low colateral value of Intangibles or growth opportunities. A software company would be expected to have proportionately lower Inventories and plan Films In the financial Industry could be expected to have high receivables (loans and pay ables (deposits, other loans), a large ratio of assets to stockholders Financial Commercial bank (hems fitted equity (Dupont leverage), and little Industry Into the same categories as the Inventory. Financial flims would also be non-financial firms) ex pected to have low asset turnover atlos. They might also have a high gross profit percentage, Le., net Interest margin (Interest revenue less Interest Retall flims would be expected to have lots of Inventory, relatively low gross Industry Retall grocery company profit percentage, and low returns on sales (less than 4%%), and high assetA1 fx Broader Classification A B C D E 1 Broader Classification Industry Characteristics Company No. Reason Mobile phone service operators would be 2 Service Mobile phone service operator expected to have high receivables, low Industry inventories, and high property, plant, and equipment A liquor company would have high inventories, high day's inventory (spirits 3 Liquor producer and distributor must age with time), and high selling, general administrative expenses because Capital-Intens the product is heavily advertised and branded ive Industry Large integrated oil and gas An oil and gas company would be company expected to have proportionately more inventories than an airline. An airline 5 Discount airline might be more capital intensive High technology industries would be expected to have high research and development intensity (ratio of R&D 6 R&D-based semiconductor expenses to sales), and high retum on manufacturer sales (patent protection, brand value). They may also have low debt ratios because of the low collateral value of intangibles or growth opportunities.A1 fx Broader Classification A B D E High technology industries would be expected to have high research and development intensity (ratio of R&D ex penses to sales), and high return on sales (patent protection, brand value) 7 R&D-based pharmaceutical They may also have low debt ratios High-Tech manufacturer because of the low collateral value of intangibles or growth opportunities. A Industry pharmaceutical manufacturer would be expected to have the high gross profit margin and high inventories, and a high day's inventory. High technology industries would be expected to have high research and development intensity (ratio of R&D ex penses to sales), and high return on sales (patent protection, brand value). CO Computer software company They may also have low debt ratios because of the low collateral value of intangibles or growth opportunities. A software company would be expected to have proportionately lower inventories and plant, Firms in the financial industry could be expected to have high receivables (loans) and payables (deposits, other loans), a large ratio of assets to stockholders' Financial Commercial bank (items fitted equity (Dupont leverage), and little 9 Industry into the same categories as the i inventory. Financial firms would also be non-financial firms) ex pected to have low asset tumover ratios. They might also have a high gross profit percentage, i.e., net interest margin (interest revenue less interest Retail firms would be expected to have Retail ots of inventory, relatively low gross 10 Industry Retail grocery company profit percentage, and low retums on sales (less than 4%), and high asset