Question: Review Table 15.1, answer these questions: 1. What changes or patterns do you see in the data? 2. Has the CEO carried out his/her responsibility
Review Table 15.1, answer these questions:
1. What changes or patterns do you see in the data?
2. Has the CEO carried out his/her responsibility for educating the board? Why or why not?
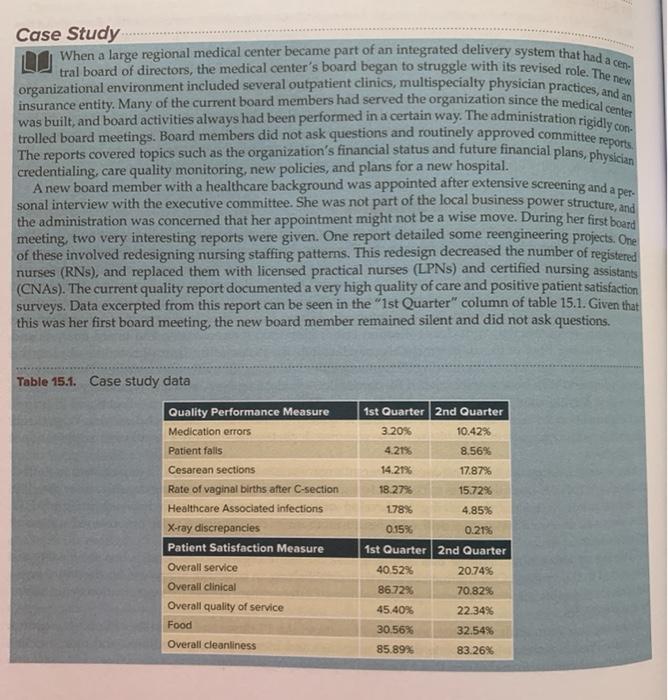
Case Study a large regional medical center became part of an integrated delivery system that had a ceny When tral board of directors, the medical center's board began to struggle with its revised role. The new organizational environment included several outpatient clinics, multispecialty physician practices, and an insurance entity. Many of the current board members had served the organization since the medical center was built, and board activities always had been performed in a certain way. The administration rigidly con- The reports covered topics such as the organization's financial status and future financial plans, physician credentialing, care quality monitoring, new policies, and plans for a new hospital. A new board member with a healthcare background was appointed after extensive screening and a per sonal interview with the executive committee. She was not part of the local business power structure , and the administration was concerned that her appointment might not be a wise move. During her first board meeting, two very interesting reports were given. One report detailed some reengineering projects . One of these involved redesigning nursing staffing patterns. This redesign decreased the number of registered nurses (RNs), and replaced them with licensed practical nurses (LPNs) and certified nursing assistants (CNAs). The current quality report documented a very high quality of care and positive patient satisfaction surveys. Data excerpted from this report can be seen in the "1st Quarter" column of table 15.1. Given that this was her first board meeting, the new board member remained silent and did not ask questions. 1st Quarter 2nd Quarter 3 20% 10.42% 4.2195 8.56% 14.21% 17.87% 18.27% 15.72% Table 15.1. Case study data Quality Performance Measure Medication errors Patient falls Cesarean sections Rate of vaginal births after C-section Healthcare Associated infections X-ray discrepancies Patient Satisfaction Measure Overall service Overall clinical Overall quality of service Food Overall cleanliness 178% 4.85% 0.15% 0.21% 1st Quarter 2nd Quarter 40.52% 20.74% 86.7296 70.82% 45.40% 22.34% 30.56% 85,89% 32.54% 83.26% ity Within four months, the new nursing staffing pattern had been launched. Data excerpted from the qual- indicators report presented to the board can be seen in the "2nd Quarter" column of table 15.1. After reviewing the data presented by the nurse administrator, the new board member was very concerned and decided to ask if the values in the quality report, which show a negative trend, were for the nursing units with the new nursing staffing patterns. The administrator reported that there was a direct correlation. This answer initiated discussion among other board members who were accustomed to using quality indicators seen. One board member wanted to know whether any data had been gathered from patient focus groups. Another board member asked whether the average length-of-stay data had increased, and someone else asked about a cost-benefit analysis of the new staffing patterns. Following the usual process, the chair called for approval of the report and presentation of the next item on the agenda