

Question: Review the graph showing the contractor's estimate at completion (EAC) for the armament Work Breakdown Structure (WBS) element, along with the Government's optimistic (best case)
Review the graph showing the contractor's estimate at completion (EAC) for the armament Work Breakdown Structure (WBS) element, along with the Government's optimistic (best case) and pessimistic (worst case) EACs. Based on the graph, does the contractor's EAC appear to be reasonable?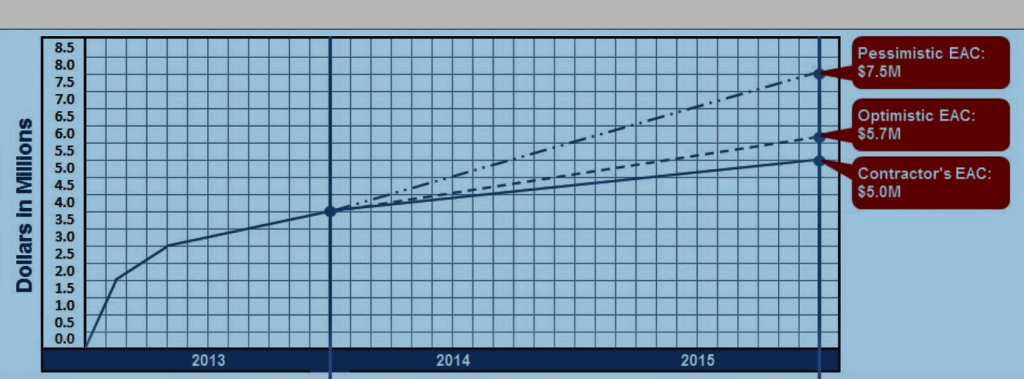 (IMAGE DESCRIPTION: EAC chart, with dollars in the millions. Pessimistic EAC is $7.5M, Optimistic EAC is $5.7M, and Contractor's EAC is $5.0M.) *
Yes, the contractor?s EAC is below the optimistic EAC calculated by the Government.
It is not possible to tell from the graph where the contractor?s EAC falls.
No, the contractor?s EAC is below the range of EACs calculated by the Government.
No, the contractor?s EAC is above the pessimistic EAC calculated by the Government.
Pessimistic EAC $7.5M Optimistic EAC Contractor's EAC 2015 2014 2013
Step by Step Solution
There are 3 Steps involved in it

Get step-by-step solutions from verified subject matter experts