

Question: Review View Developer Sample Ratios Solved - Word (Product Activation Failed) Tell me what you want to do... PRACTICE QUESTION WITH SOLUTION Question: Calculate
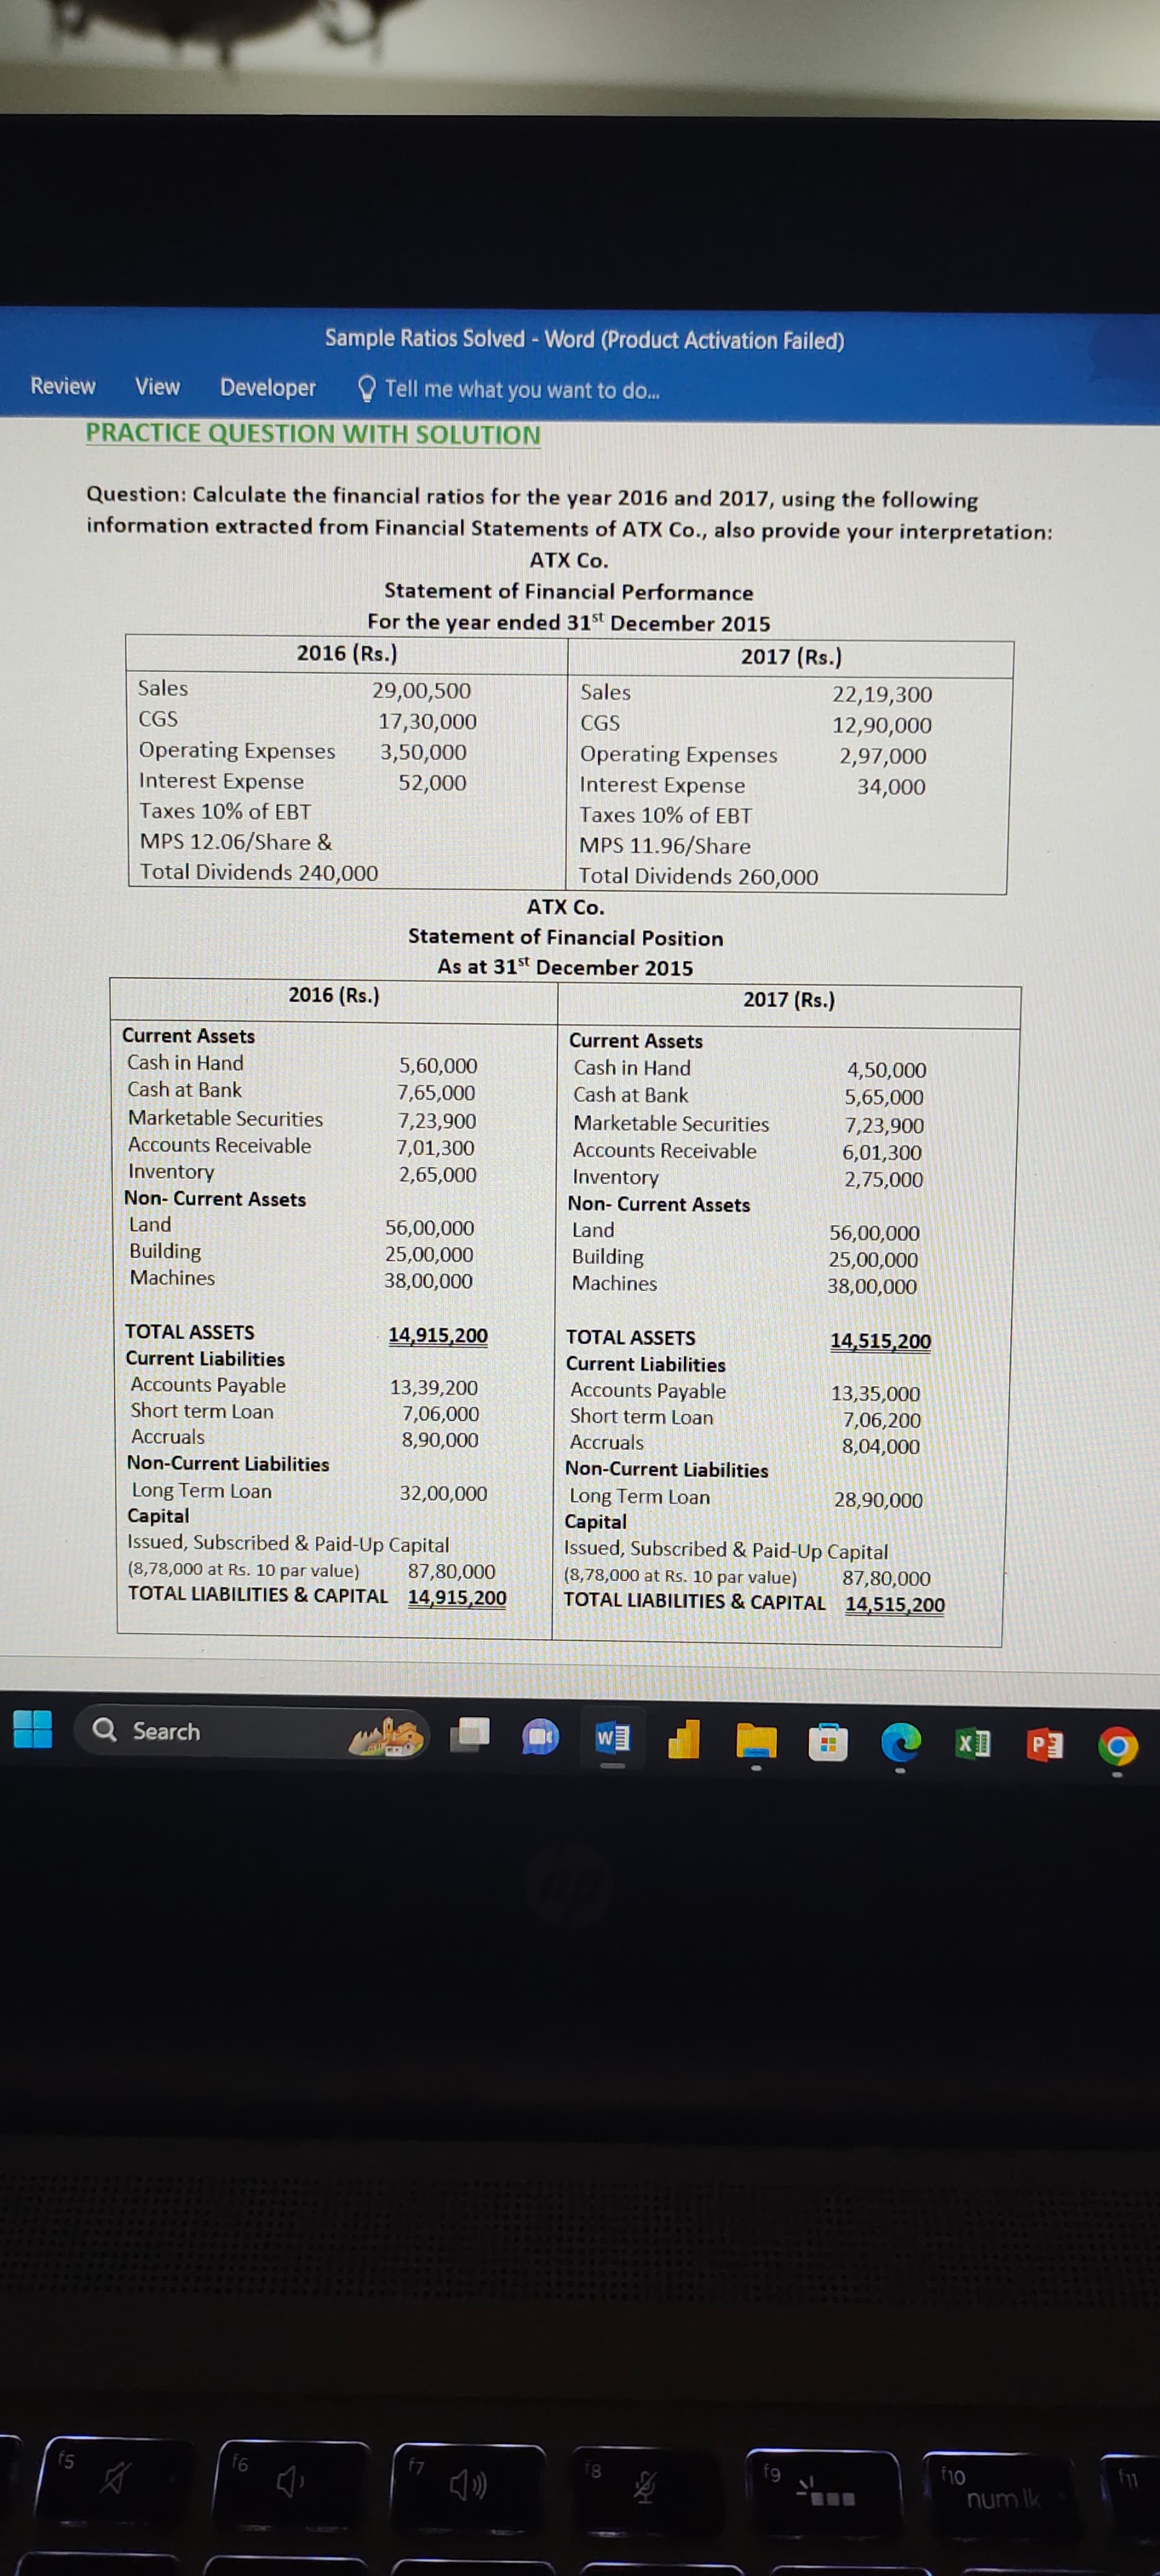
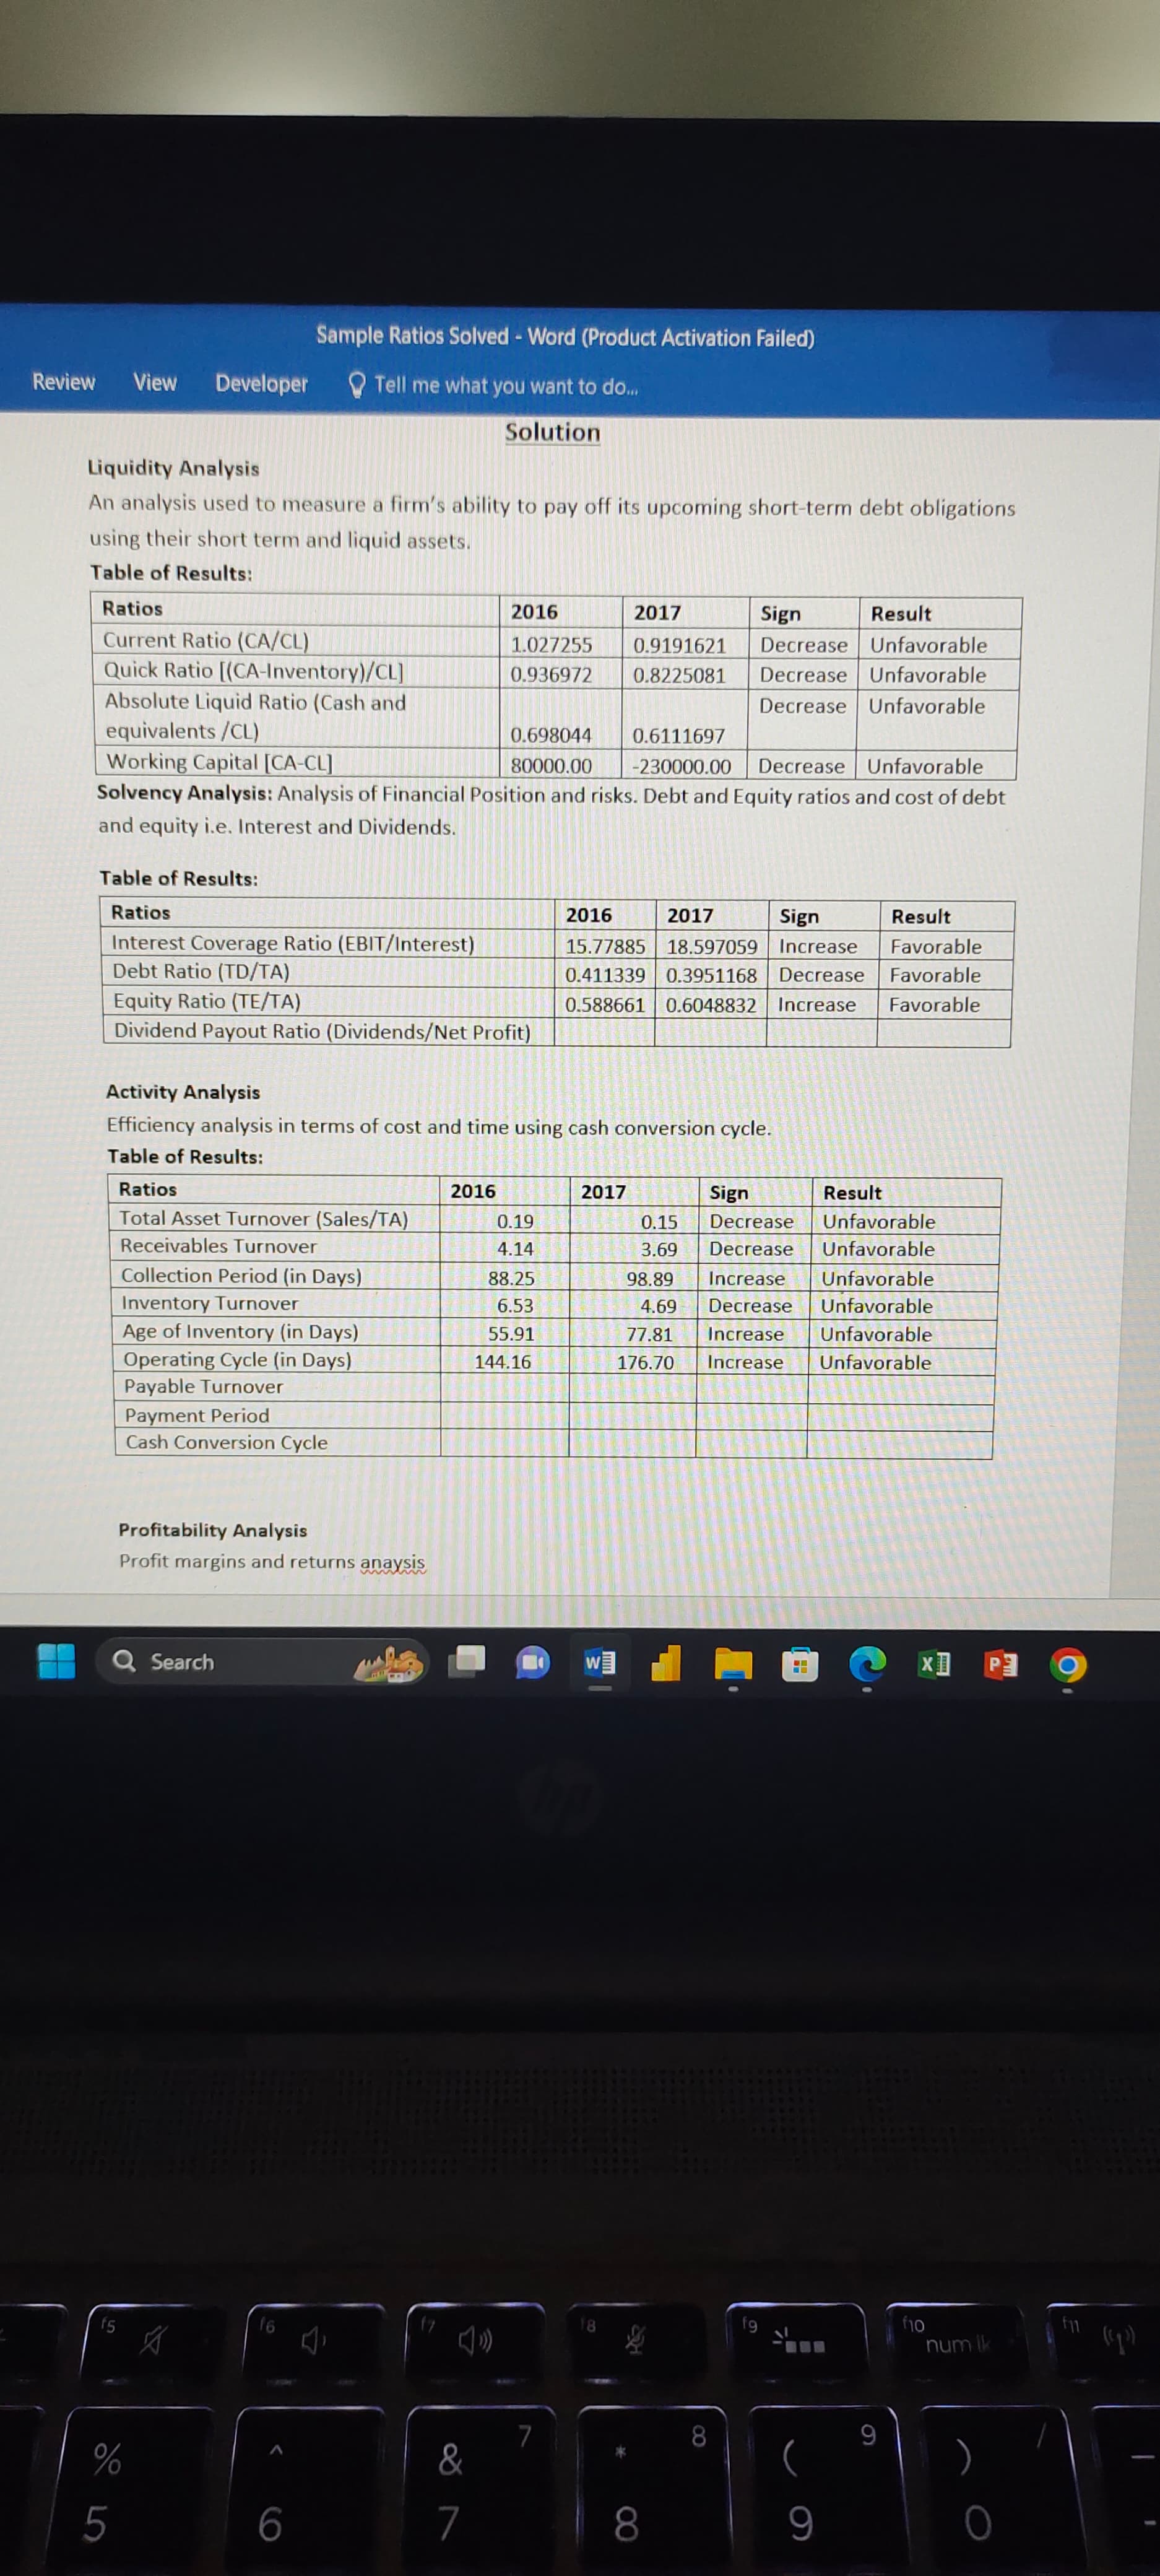
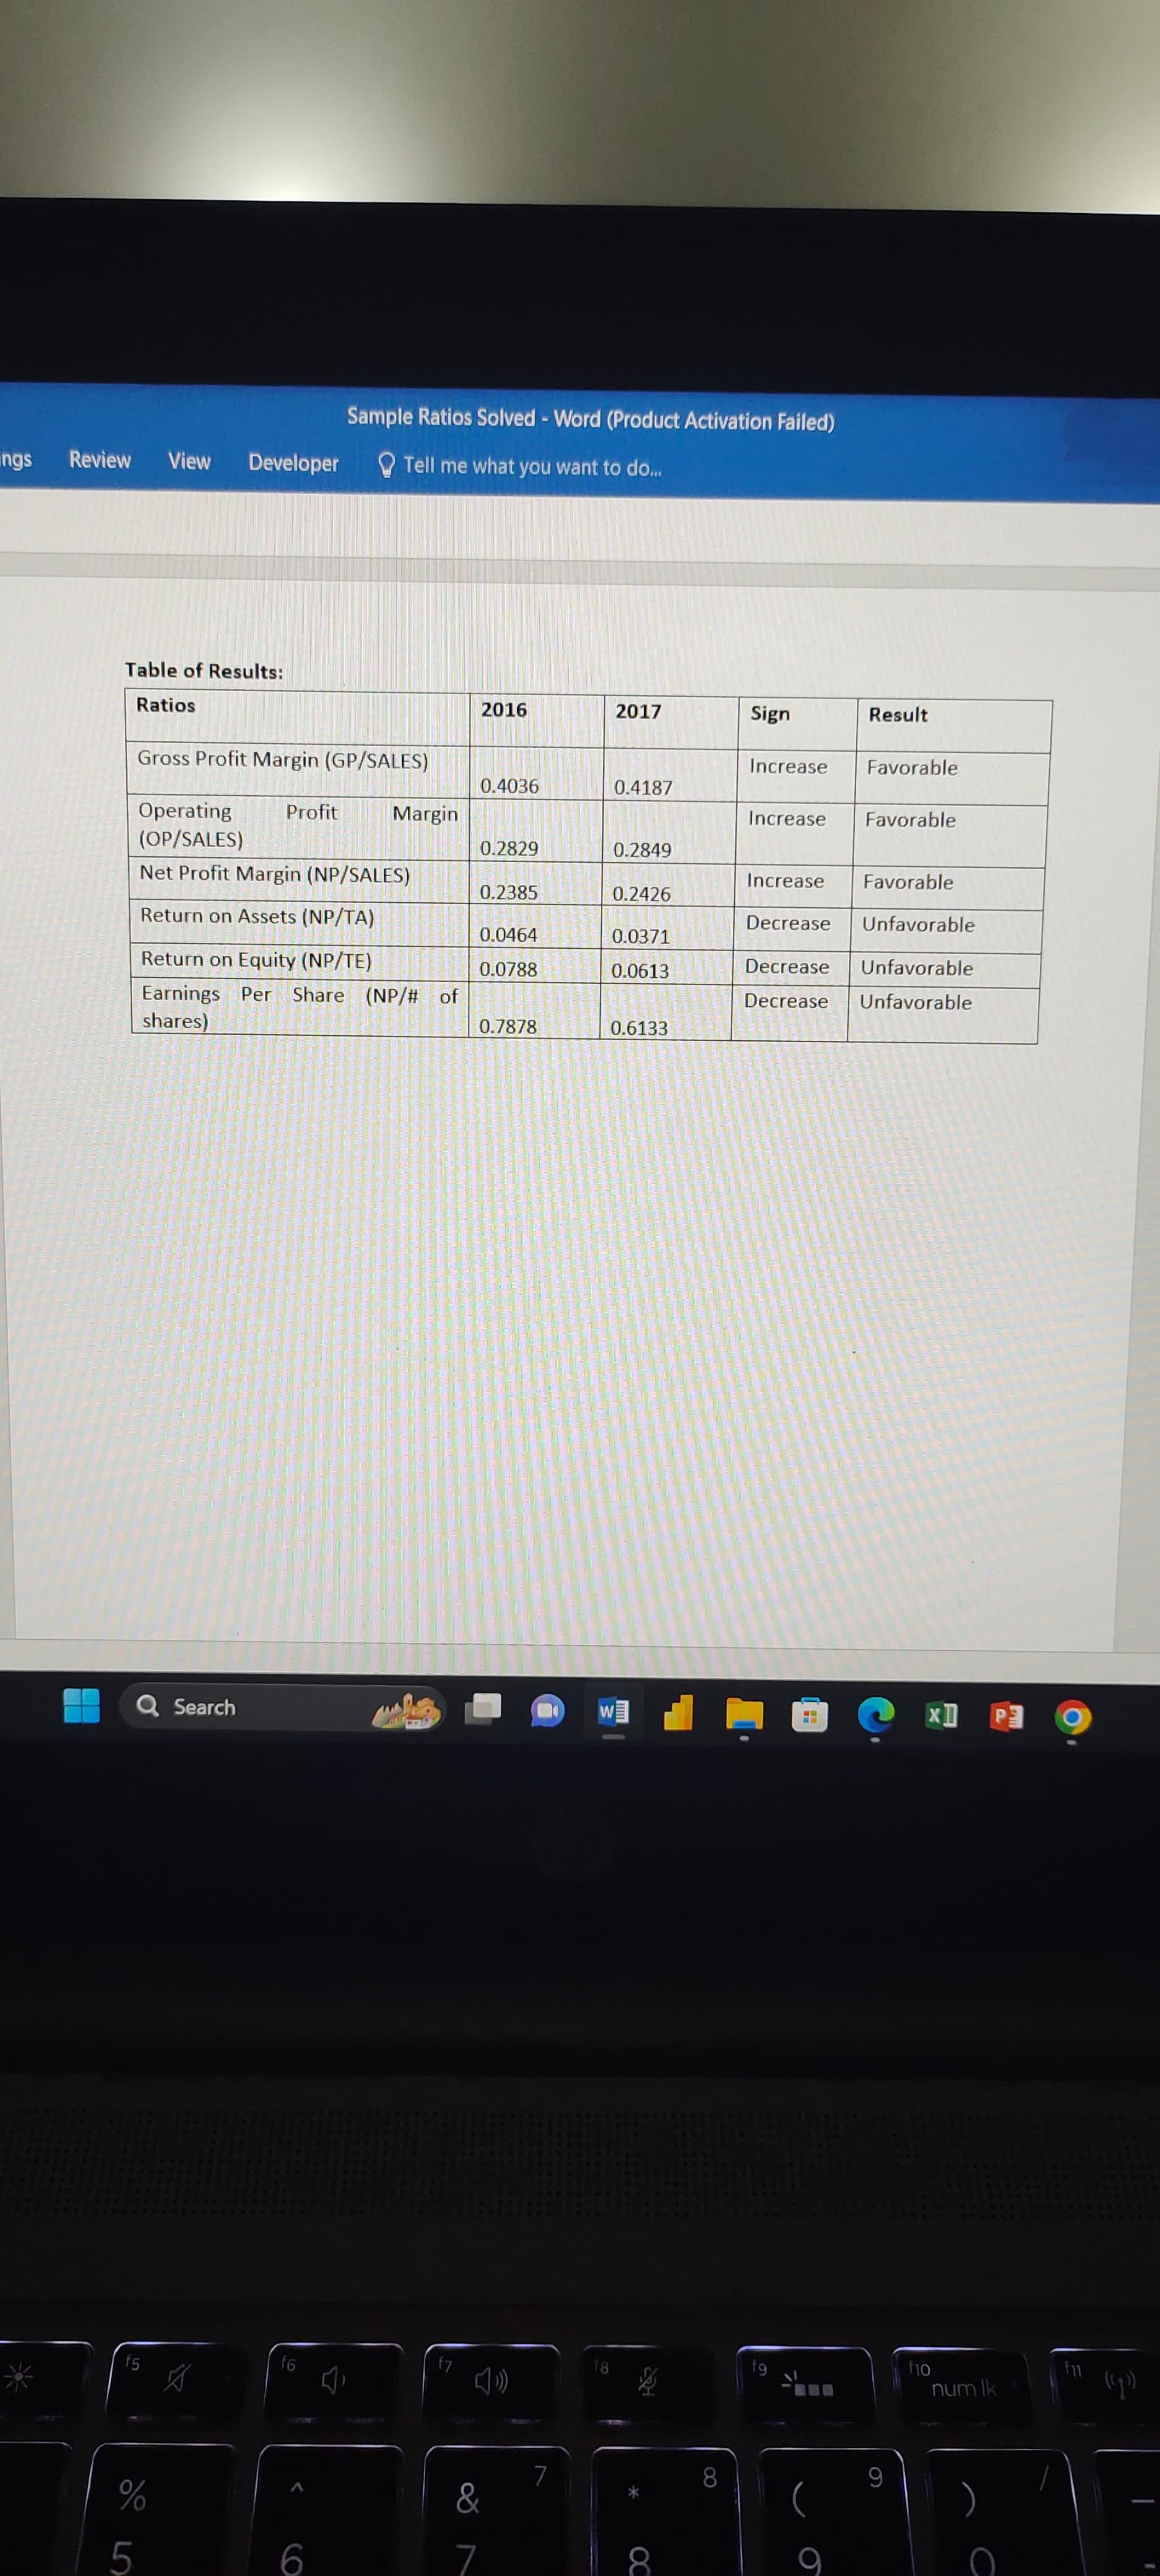
Review View Developer Sample Ratios Solved - Word (Product Activation Failed) Tell me what you want to do... PRACTICE QUESTION WITH SOLUTION Question: Calculate the financial ratios for the year 2016 and 2017, using the following information extracted from Financial Statements of ATX Co., also provide your interpretation: ATX Co. Statement of Financial Performance For the year ended 31st December 2015 2016 (Rs.) 2017 (Rs.) Sales CGS 29,00,500 Sales 22,19,300 17,30,000 CGS 12,90,000 Operating Expenses 3,50,000 Operating Expenses 2,97,000 Interest Expense 52,000 Interest Expense 34,000 Taxes 10% of EBT Taxes 10% of EBT MPS 12.06/Share & MPS 11.96/Share Total Dividends 240,000 Total Dividends 260,000 ATX Co. Statement of Financial Position As at 31st December 2015 2016 (Rs.) 2017 (Rs.) Current Assets Current Assets Cash in Hand 5,60,000 Cash in Hand 4,50,000 Cash at Bank 7,65,000 Cash at Bank 5,65,000 Marketable Securities 7,23,900 Marketable Securities 7,23,900 Accounts Receivable 7,01,300 Accounts Receivable 6,01,300 Inventory 2,65,000 Inventory 2,75,000 Non-Current Assets Non-Current Assets Land 56,00,000 Land 56,00,000 Building 25,00,000 Building 25,00,000 Machines 38,00,000 Machines 38,00,000 TOTAL ASSETS 14,915,200 TOTAL ASSETS 14,515,200 Current Liabilities Current Liabilities Accounts Payable 13,39,200 Accounts Payable 13,35,000 Short term Loan 7,06,000 Short term Loan 7,06,200 Accruals 8,90,000 Accruals 8,04,000 Non-Current Liabilities Non-Current Liabilities Long Term Loan 32,00,000 Long Term Loan 28,90,000 Capital Capital Issued, Subscribed & Paid-Up Capital (8,78,000 at Rs. 10 par value) TOTAL LIABILITIES & CAPITAL Q Search 87,80,000 14,915,200 Issued, Subscribed & Paid-Up Capital (8,78,000 at Rs. 10 par value) 87,80,000 TOTAL LIABILITIES & CAPITAL 14,515,200 W H PE fg f5 f6 f7 f10 num lk f11 Review View Developer Sample Ratios Solved - Word (Product Activation Failed) Tell me what you want to do... Solution Liquidity Analysis An analysis used to measure a firm's ability to pay off its upcoming short-term debt obligations using their short term and liquid assets. Table of Results: Ratios 2016 2017 Sign Result Current Ratio (CA/CL) 1.027255 Decrease Quick Ratio [(CA-Inventory)/CL] 0.936972 Absolute Liquid Ratio (Cash and 0.9191621 Unfavorable 0.8225081 Decrease Unfavorable Decrease Unfavorable equivalents/CL) 0.698044 0.6111697 Working Capital [CA-CL] 80000.00 -230000.00 Decrease Unfavorable Solvency Analysis: Analysis of Financial Position and risks. Debt and Equity ratios and cost of debt and equity i.e. Interest and Dividends. Table of Results: Ratios 2016 Interest Coverage Ratio (EBIT/Interest) Debt Ratio (TD/TA) Equity Ratio (TE/TA) Dividend Payout Ratio (Dividends/Net Profit) Activity Analysis 2017 Sign Result 15.77885 18.597059 Increase Favorable 0.411339 0.3951168 Decrease Favorable 0.588661 0.6048832 Increase Favorable Efficiency analysis in terms of cost and time using cash conversion cycle. Table of Results: Ratios 2016 2017 Sign Result Total Asset Turnover (Sales/TA) 0.19 0.15 Decrease Unfavorable Receivables Turnover 4.14 Collection Period (in Days) 88.25 3.69 Decrease Unfavorable 98.89 Increase Inventory Turnover 6.53 Unfavorable 4.69 Decrease Unfavorable Age of Inventory (in Days) 55.91 Operating Cycle (in Days) 144.16 77.81 176.70 Increase Unfavorable Increase Unfavorable Payable Turnover Payment Period Cash Conversion Cycle Profitability Analysis Profit margins and returns anaysis www Q Search % 16 5 6 7 7 H x 8 9 8 9 P f10 f11 num lk ngs Review View Developer Table of Results: Sample Ratios Solved - Word (Product Activation Failed) Tell me what you want to do... Ratios 2016 2017 Sign Result Gross Profit Margin (GP/SALES) Increase Favorable 0.4036 0.4187 Operating (OP/SALES) Profit Margin Increase Favorable 0.2829 0.2849 Net Profit Margin (NP/SALES) Increase Favorable 0.2385 0.2426 Return on Assets (NP/TA) Decrease Unfavorable 0.0464 0.0371 Return on Equity (NP/TE) 0.0788 0.0613 Earnings Per Share (NP/# of Decrease Unfavorable Decrease Unfavorable shares) 0.7878 0.6133 Q Search W P 5 55 % f6 6 7 f10 num lk 7 8 9 ) OC 8 9 ((g)
Step by Step Solution
There are 3 Steps involved in it

Get step-by-step solutions from verified subject matter experts