

Question: Right or wrong. Only one correct answer per part. A. the output was obtained by fitting the bidirectional analysis of variance to the data with

Right or wrong. Only one correct answer per part.
A.
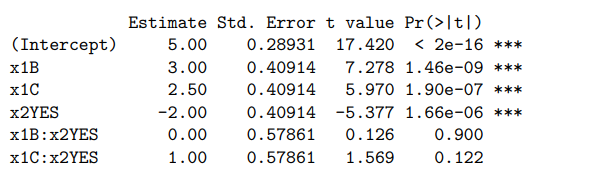
the output was obtained by fitting the bidirectional analysis of variance to the data with the response variable y is scaled, variable x1 can be A, B or C and variable x2 can be YES or NO. (See image 1.)
When x1 = B and x2 = YES, the estimate of the population mean (= expected value) of the variable y is
i 5
ii. 6
iii. 0
B.
the point estimate for the population mean (= expectation value) of the variable y was 15. The lower limit of the 95% confidence interval was 10 and the upper limit was 20.
i. The population mean of the variable y is 15.
ii. The population mean of the variable y is between (10, 20).
iii. The population mean of the variable y is quite certainly between (10, 20).
C.
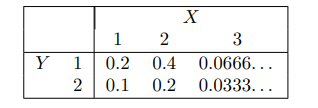
Consider random variables X and Y, for which the point probability function of the common distribution is shown
below. Which of the following statements is not true? (See image 2.)
Estimate Std. Error t value Pr(>|t) (Intercept) 5.00 0. 28931 17.420
Step by Step Solution
There are 3 Steps involved in it

Get step-by-step solutions from verified subject matter experts