

Question: Router aggregate Planning strategy (15 marks) Switch aggregate Planning strategy (15 marks) 3) 30 marks) Ultraflet an electronics contract manufacturer, uses its facilities to produce
 Router aggregate Planning strategy (15 marks)
Switch aggregate Planning strategy (15 marks)
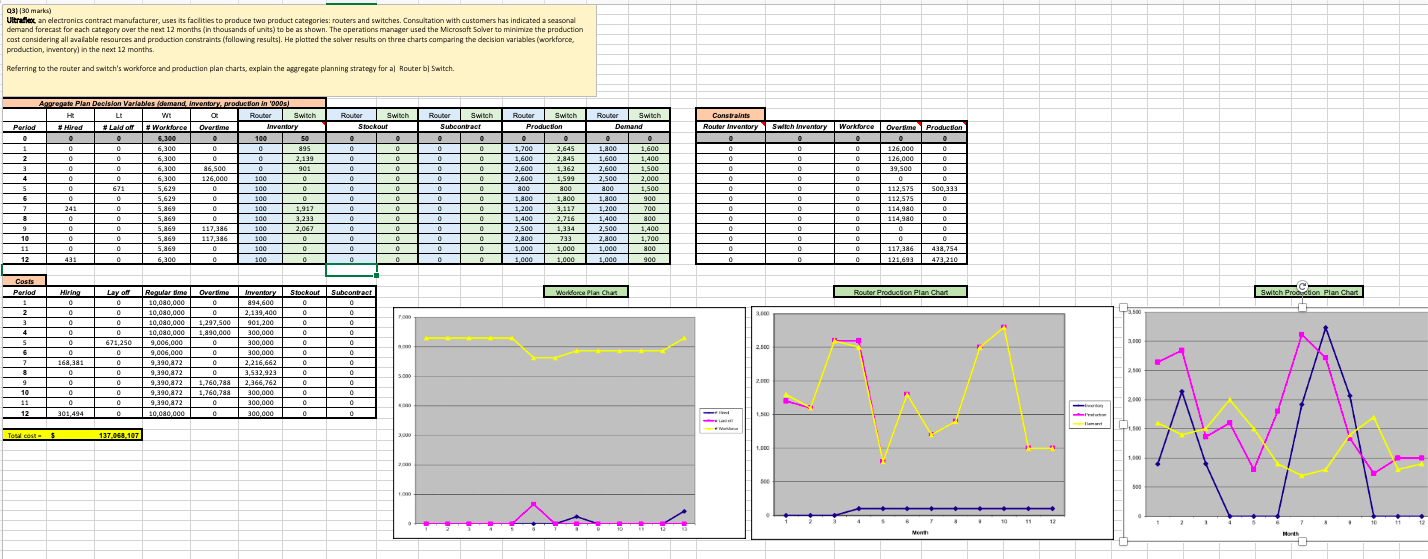
3) 30 marks) Ultraflet an electronics contract manufacturer, uses its facilities to produce two product categories: routers and switches. Consultation with customers has indicated a seasonal demand forecast for each category over the next 12 months (in thousands of units) to be as shown. The operations manager used the Microsoft Solver to minimize the production cost considering all available resources and production constraints (following results). He plotted the solver results on three charts comparing the decision variables (workforce, production, Inventory) in the next 12 months Referring to the router and switch's workforce and production plan charts, explain the aggregate planning strategy for al Router by Switch Roubor HE Router Switch Production Router Switch Demand Constraints Router Inventory Switch Inventory 0 0 0 Aggregate Plan Decision Variables demand. Inventory.production in '000s) H LE W O ter Switch Period # Hired #Lald off # Workforce Over time Inventory 6,300 100 50 1 0 6,300 0 0 895 2 0 6,300 0 0 2,139 3 0 0 6,300 86,500 0 901 4 0 0 6,300 126,000 100 0 S 0 671 5,629 0 100 0 0 0 5,629 0 100 7 241 0 5,869 0 100 1,917 8 0 0 5,869 0 100 3,233 9 0 0 5,869 117,386 100 2,067 10 0 5,869 117,386 100 0 11 0 0 5,869 0 0 100 0 12 431 0 6300 0 100 0 Router Switch Stockout 0 0 0 0 0 0 0 0 0 0 0 0 0 0 0 0 0 0 0 0 0 0 0 0 Router Switch Subcontract C 0 0 0 0 0 0 0 0 0 0 0 0 0 0 0 0 0 0 0 0 0 0 0 1,700 2.645 1,800 1,600 1,600 2,845 1,600 1,400 2,600 1,362 2.600 1,500 2,600 1,599 2,500 2,000 800 800 800 1,500 1,800 1,800 1,800 900 1,200 3,117 1,200 700 1,400 2,716 1,400 800 2,500 1,334 2.500 1,400 2,800 733 2,800 1,700 1,000 1,000 1,000 800 1,000 1,000 1,000 900 0 0 0 0 0 0 0 0 0 0 Workforce Overtime Production . 0 0 0 126,000 0 0 0 126,000 0 0 39,500 0 0 0 0 0 112,575 500,333 112,575 0 0 114,980 0 0 114,980 0 0 0 0 0 0 0 0 0 117,386488,754 0 121,693 473,210 0 0 0 0 0 0 0 Layor Workforce Plan Chart Router Production Plan Chart Switch Production Plan Chart Hiring 0 0 200 3.500 Costs Period 1 2 2 3 4 S 6 7 0 o 0 0 671,250 0 0 0 3.000 0 0 168,381 2.300 Regular time Overtime 10,080,000 0 10,080,000 0 10,080,000 1,297,500 10,080,000 1990.00 1,890,000 9,006,000 0 9,006,000 0 9,390,872 0 9,390,872 0 9,390,872 1,760,788 9,390,872 1,760,788 9,190,872 0 10.080.000 0 Inventory Stockout Subcontract 894,600 0 0 2,139,400 0 0 901,200 0 0 300,000 0 0 300,000 0 0 300,000 0 0 2,216,662 0 0 3,532,923 0 0 2,366,762 0 0 300,000 0 0 300,000 0 0 300,000 0 0 2.500 5.000 2.000 0 0 9 10 11 12 2000 0 301.494 0 0 0 1.500 1.500 Total cost $ 137.068.107 3.00 1.000 500 10 6 7 8 . 10 11 12 2 10 11 12 North 3) 30 marks) Ultraflet an electronics contract manufacturer, uses its facilities to produce two product categories: routers and switches. Consultation with customers has indicated a seasonal demand forecast for each category over the next 12 months (in thousands of units) to be as shown. The operations manager used the Microsoft Solver to minimize the production cost considering all available resources and production constraints (following results). He plotted the solver results on three charts comparing the decision variables (workforce, production, Inventory) in the next 12 months Referring to the router and switch's workforce and production plan charts, explain the aggregate planning strategy for al Router by Switch Roubor HE Router Switch Production Router Switch Demand Constraints Router Inventory Switch Inventory 0 0 0 Aggregate Plan Decision Variables demand. Inventory.production in '000s) H LE W O ter Switch Period # Hired #Lald off # Workforce Over time Inventory 6,300 100 50 1 0 6,300 0 0 895 2 0 6,300 0 0 2,139 3 0 0 6,300 86,500 0 901 4 0 0 6,300 126,000 100 0 S 0 671 5,629 0 100 0 0 0 5,629 0 100 7 241 0 5,869 0 100 1,917 8 0 0 5,869 0 100 3,233 9 0 0 5,869 117,386 100 2,067 10 0 5,869 117,386 100 0 11 0 0 5,869 0 0 100 0 12 431 0 6300 0 100 0 Router Switch Stockout 0 0 0 0 0 0 0 0 0 0 0 0 0 0 0 0 0 0 0 0 0 0 0 0 Router Switch Subcontract C 0 0 0 0 0 0 0 0 0 0 0 0 0 0 0 0 0 0 0 0 0 0 0 1,700 2.645 1,800 1,600 1,600 2,845 1,600 1,400 2,600 1,362 2.600 1,500 2,600 1,599 2,500 2,000 800 800 800 1,500 1,800 1,800 1,800 900 1,200 3,117 1,200 700 1,400 2,716 1,400 800 2,500 1,334 2.500 1,400 2,800 733 2,800 1,700 1,000 1,000 1,000 800 1,000 1,000 1,000 900 0 0 0 0 0 0 0 0 0 0 Workforce Overtime Production . 0 0 0 126,000 0 0 0 126,000 0 0 39,500 0 0 0 0 0 112,575 500,333 112,575 0 0 114,980 0 0 114,980 0 0 0 0 0 0 0 0 0 117,386488,754 0 121,693 473,210 0 0 0 0 0 0 0 Layor Workforce Plan Chart Router Production Plan Chart Switch Production Plan Chart Hiring 0 0 200 3.500 Costs Period 1 2 2 3 4 S 6 7 0 o 0 0 671,250 0 0 0 3.000 0 0 168,381 2.300 Regular time Overtime 10,080,000 0 10,080,000 0 10,080,000 1,297,500 10,080,000 1990.00 1,890,000 9,006,000 0 9,006,000 0 9,390,872 0 9,390,872 0 9,390,872 1,760,788 9,390,872 1,760,788 9,190,872 0 10.080.000 0 Inventory Stockout Subcontract 894,600 0 0 2,139,400 0 0 901,200 0 0 300,000 0 0 300,000 0 0 300,000 0 0 2,216,662 0 0 3,532,923 0 0 2,366,762 0 0 300,000 0 0 300,000 0 0 300,000 0 0 2.500 5.000 2.000 0 0 9 10 11 12 2000 0 301.494 0 0 0 1.500 1.500 Total cost $ 137.068.107 3.00 1.000 500 10 6 7 8 . 10 11 12 2 10 11 12 NorthStep by Step Solution
There are 3 Steps involved in it
1 Expert Approved Answer
Step: 1 Unlock

Question Has Been Solved by an Expert!
Get step-by-step solutions from verified subject matter experts
Step: 2 Unlock
Step: 3 Unlock