Question: THE QUESTION IS SOLVED IN THE SOLVER . the Question 3 MCP, an electronics contract manufacturer, uses its Manitoba, Ontario facilities to produce two product
THE QUESTION IS SOLVED IN THE SOLVER .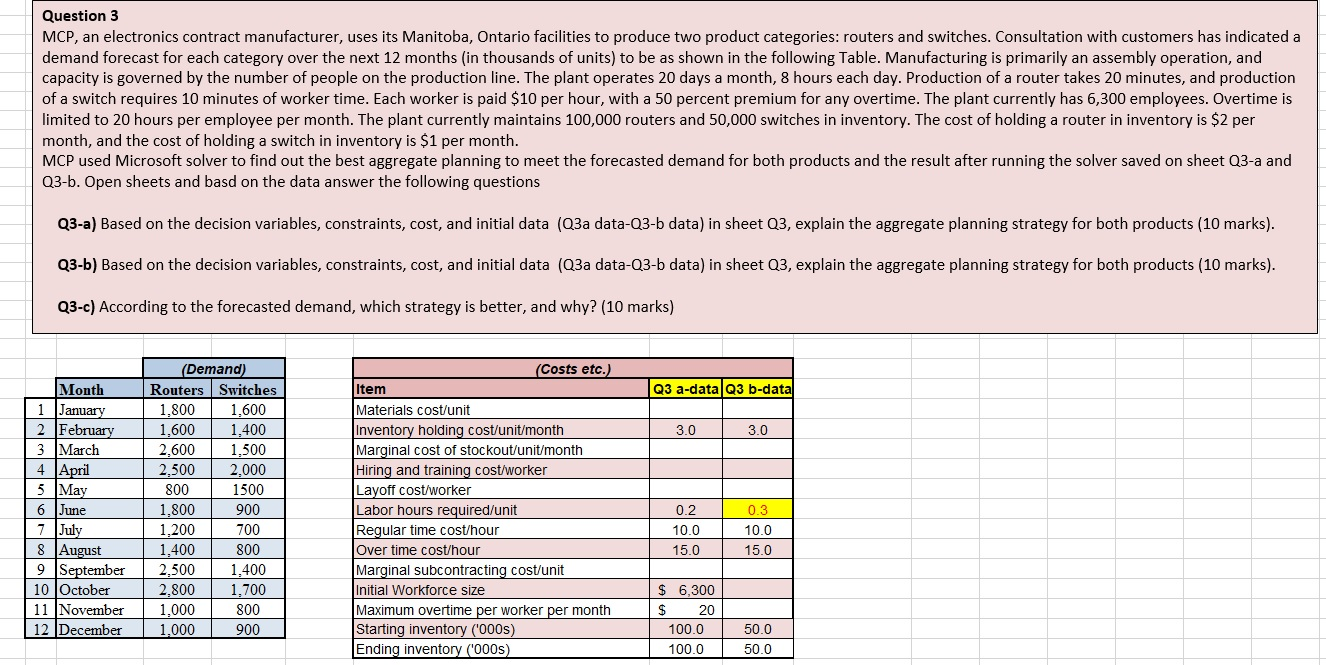
 the
the 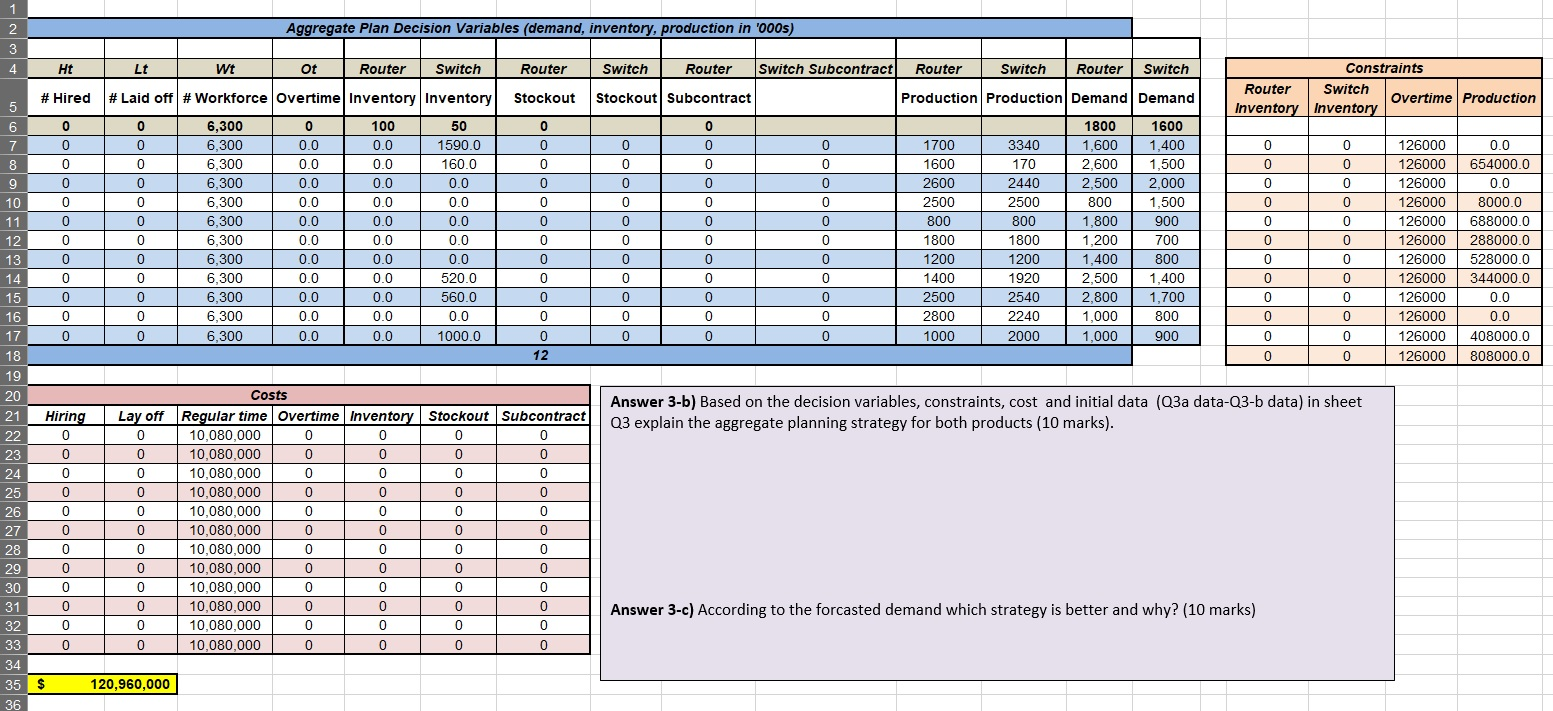
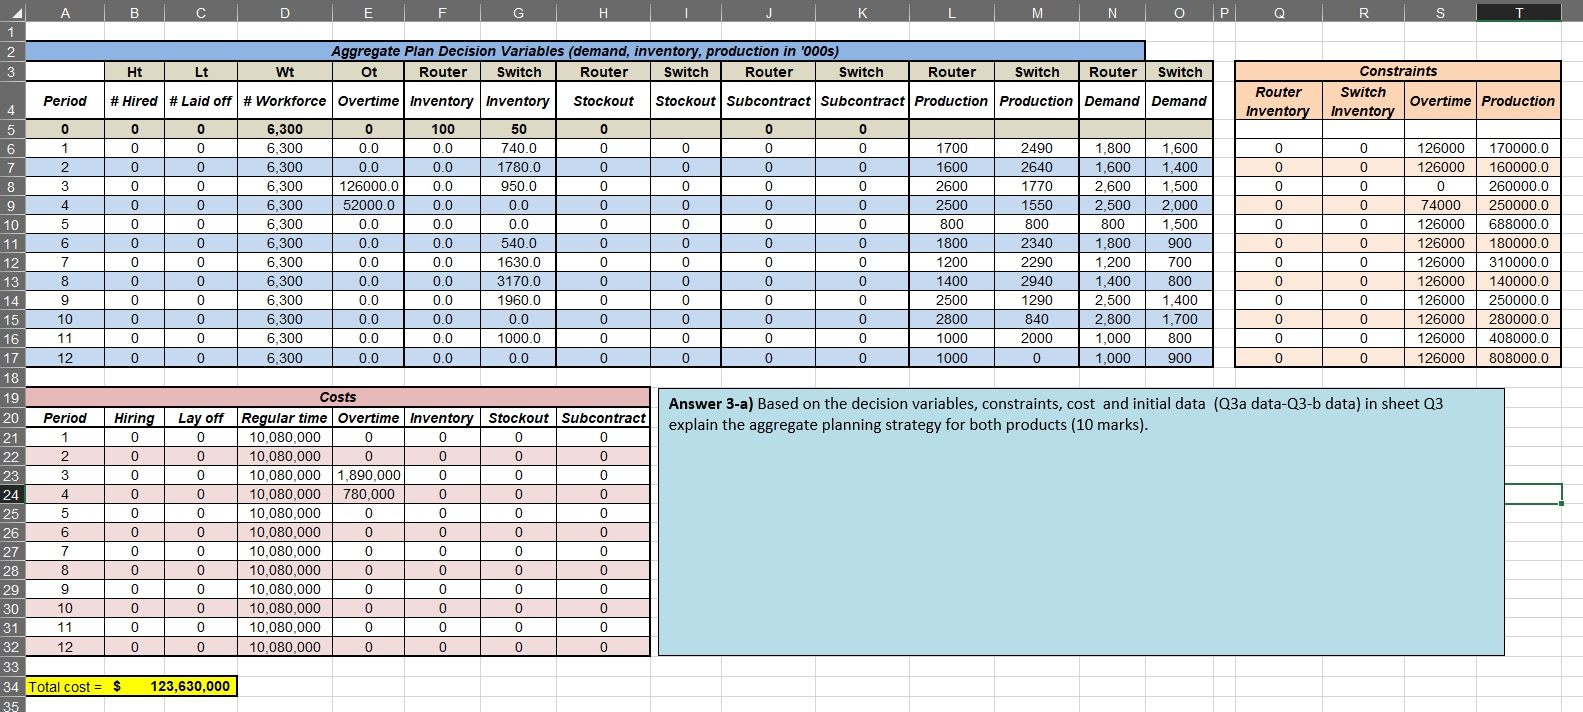
Question 3 MCP, an electronics contract manufacturer, uses its Manitoba, Ontario facilities to produce two product categories: routers and switches. Consultation with customers has indicated a demand forecast for each category over the next 12 months in thousands of units) to be as shown in the following Table. Manufacturing is primarily an assembly operation, and capacity is governed by the number of people on the production line. The plant operates 20 days a month, 8 hours each day. Production of a router takes 20 minutes, and production of a switch requires 10 minutes of worker time. Each worker is paid $10 per hour, with a 50 percent premium for any overtime. The plant currently has 6,300 employees. Overtime is limited to 20 hours per employee per month. The plant currently maintains 100,000 routers and 50,000 switches in inventory. The cost of holding a router in inventory is $2 per month, and the cost of holding a switch in inventory is $1 per month. MCP used Microsoft solver to find out the best aggregate planning to meet the forecasted demand for both products and the result after running the solver saved on sheet Q3-a and Q3-b. Open sheets and basd on the data answer the following questions Q3-a) Based on the decision variables, constraints, cost, and initial data (Q3a data-Q3-b data) in sheet Q3, explain the aggregate planning strategy for both products (10 marks). Q3-b) Based on the decision variables, constraints, cost, and initial data (Q3a data-Q3-b data) in sheet Q3, explain the aggregate planning strategy for both products (10 marks). Q3-c) According to the forecasted demand, which strategy is better, and why? (10 marks) (Costs etc.) Item Q3 a-data Q3 b-data 3.0 3.0 Month | 1 January 2 February 3 March 4 April 5 May 6 June 7 July 8 August 9 September 10 October 11 November 12 December (Demand) Routers Switches 1.800 1.600 | 1,600 1,400 2,600 1,500 2.500 2.000 800 1500 1.800 900 1,200 700 1.400 800 2.500 1,400 2.800 1.700 1.000 800 | 1.000 900 Materials cost/unit Inventory holding cost/unit/month Marginal cost of stockout/unit/month Hiring and training cost/worker Layoff cost/worker Labor hours required/unit Regular time cost/hour Over time cost/hour Marginal subcontracting cost/unit Initial Workforce size Maximum overtime per worker per month Starting inventory ('000s) Ending inventory ('000s) 0.2 10.0 15.0 0.3 10.0 15.0 $ 6,300 20 100.0 | 100.0 50.0 50.0 A B C D E F G H I J K M N O P Q R S T Aggregate Plan Decision Variables (demand, inventory, production in '000s) Ot Router Switch Router | Router Switch Ht Lt Wt Router | Switch Router Switch Constraints Switch Overtime Production Inventory Period Stockout Router Inventory Stockout Subcontract Subcontract Production Production Demand Demand 0 0 0 0 0 | 0 nn 0 | 0 os||A # Hired # Laid off # Workforce Overtime Inventory Inventory 6,300 100 50 | 0 | 0 | 6,300 1 0 0 1 0 0 740.0 6,300 0 0 | 1780.0 6,300 126000.0| 950.0 0 | 0 6,300 52000.0 | 0.0 0 o 6,300 0 0 0.0 0 6,300 0.0 | 540.0 0 6,300 0.0 16300 6,300 0.0 l 0.0 3170.0 | 0 | 0 6,300 0.0 1960.0 0 0 6,300 0.0 | 0.0 | 0 0 ) 6,300 0.0 | 1000.00 | 0 | 0 | 6,300 | 0.0 | 0.0 | 0 0 | 0 l 0 1700 1600 2600 2500 800 1800 ) 1200 1400 2500 2800 1000 1000 0 2490 ) 1,800 | 1,600 2640 1,600 1,400 1770 2,600 ) 1,500 1550 2,500 ) 2,000 800 800 ) 1,500 2340 1,800 900 2290 1,200 700 2940 1,400 | 800 1290 2,500 | 1,400 | 840 2,800 L 1,700 2000 1,000 1 800 ) 0 | 1,000 1 900 126000 | 170000.0 126000 ) 160000.0 0 260000.0 74000 1250000.0 126000 | 688000.0 126000 / 180000.0 126000 1 310000.0 126000 L 140000.0 126000 1250000.0 | 126000 L 280000.0 126000 1 4080000 | 126000 | 808000.0 | 0 - 0.0 0 | 0.0 0 0 0 ) | | 0 0 0 0 12 0 | 0 | | | Period Hiring Stockout Subcontract Answer 3-a) Based on the decision variables, constraints, cost and initial data (Q3a data-Q3-b data) in sheet Q3 explain the aggregate planning strategy for both products (10 marks). 0 ) Costs Lay off Regular time Overtime Inventory | 10,080,000 0 10,080,000 | 0 10,080,000 11,890,000] 10,080,000 L 780,000 10,080,000 10,080,000 10,080,000 0 | 10,080,000 | 0 10,080,000 10,080,000 10,080,000 0 10,080,000 288 | | 0 | 0 0 12 | 0 | 123,30, 34 Total cost = $ 35 Aggregate Plan Decision Variables (demand, inventory, production in '000s) Router Stockout Switch Router Switch Subcontract| Router Switch Router Switch Stockout Subcontract Production Production Demand Demand Constraints Router Switch Overtime Production Inventory Inventory | 0 | 0 0 0 | | 0 0 | 0 0 Ht Lt ) Wt Ot Router Switch # Hired # Laid off # Workforce Overtime Inventory Inventory 6,300 | 100 | 50 | 0 6,300 | 0.0 0.0 | 1590.0 | 6,300 | 0 0 | 160.0 | 6,300 0.0 6,300 0 0 6,300 0.0 0.0 6,300 0.0 6,300 0.0 | 6,300 0 0 0.0 520.0 6,300 0 0 0 0 560.0 6,300 0 0 0.0 0 | 6,300 | 0 0 1 0 0 1 1000.0 | 1000.0 | 0 0 0 0 | 0 2440 nn 1700 ) 1600 2600 2500 800 ) 1800 ) 1200 1400 2500 2800 ) 1000 | 1800 | 1600 3340 ) 1600 L 1,400 | 170 1 2,600 L 1,500 | 2,500 L 2,000 2500 800 1 1,500 800 ) 1,800 L 900 1800 ) 1,200 700 1200 1,400 1920 2,500 1,400 2,800 | 1,700 2240 800 2000 | 1,000 | 900 ) 0.0 | 126000 1 126000 | 654000.0 126000 0.0 126000 18000.0 126000 | 688000.0 126000 288000.0 126000 1 528000.0 126000 | 344000.0 126000 0.0 126000 | 0.0 126000 1 408000.0 | 126000 | 8080000 in | 800 0 0 0 0 L 2540 0.0 16 17 0 12 | 0 0 0 0 18 0 | Hiring Answer 3-b) Based on the decision variables, constraints, cost and initial data (Q3a data-Q3-b data) in sheet Q3 explain the aggregate planning strategy for both products (10 marks). Costs Lay off Regular time Overtime Inventory Stockout Subcontract 10,080,000 0 10,080,000 10,080,000 10,080,000 10,080,000 10,080,000 10,080,000 10,080,000 10,080,000 10,080,000 10,080,000 0 0 10,080,000 | | 0 | 0 | 0 | Answer 3-c) According to the forcasted demand which strategy is better and why? (10 marks) 0 | | 35 $ 120,9, 36


