

Question: Run a correlation analysis for PRICE by ROOMSERV. (10 points) Is the correlation significant or not? Explain why or why not. (1 point) What is
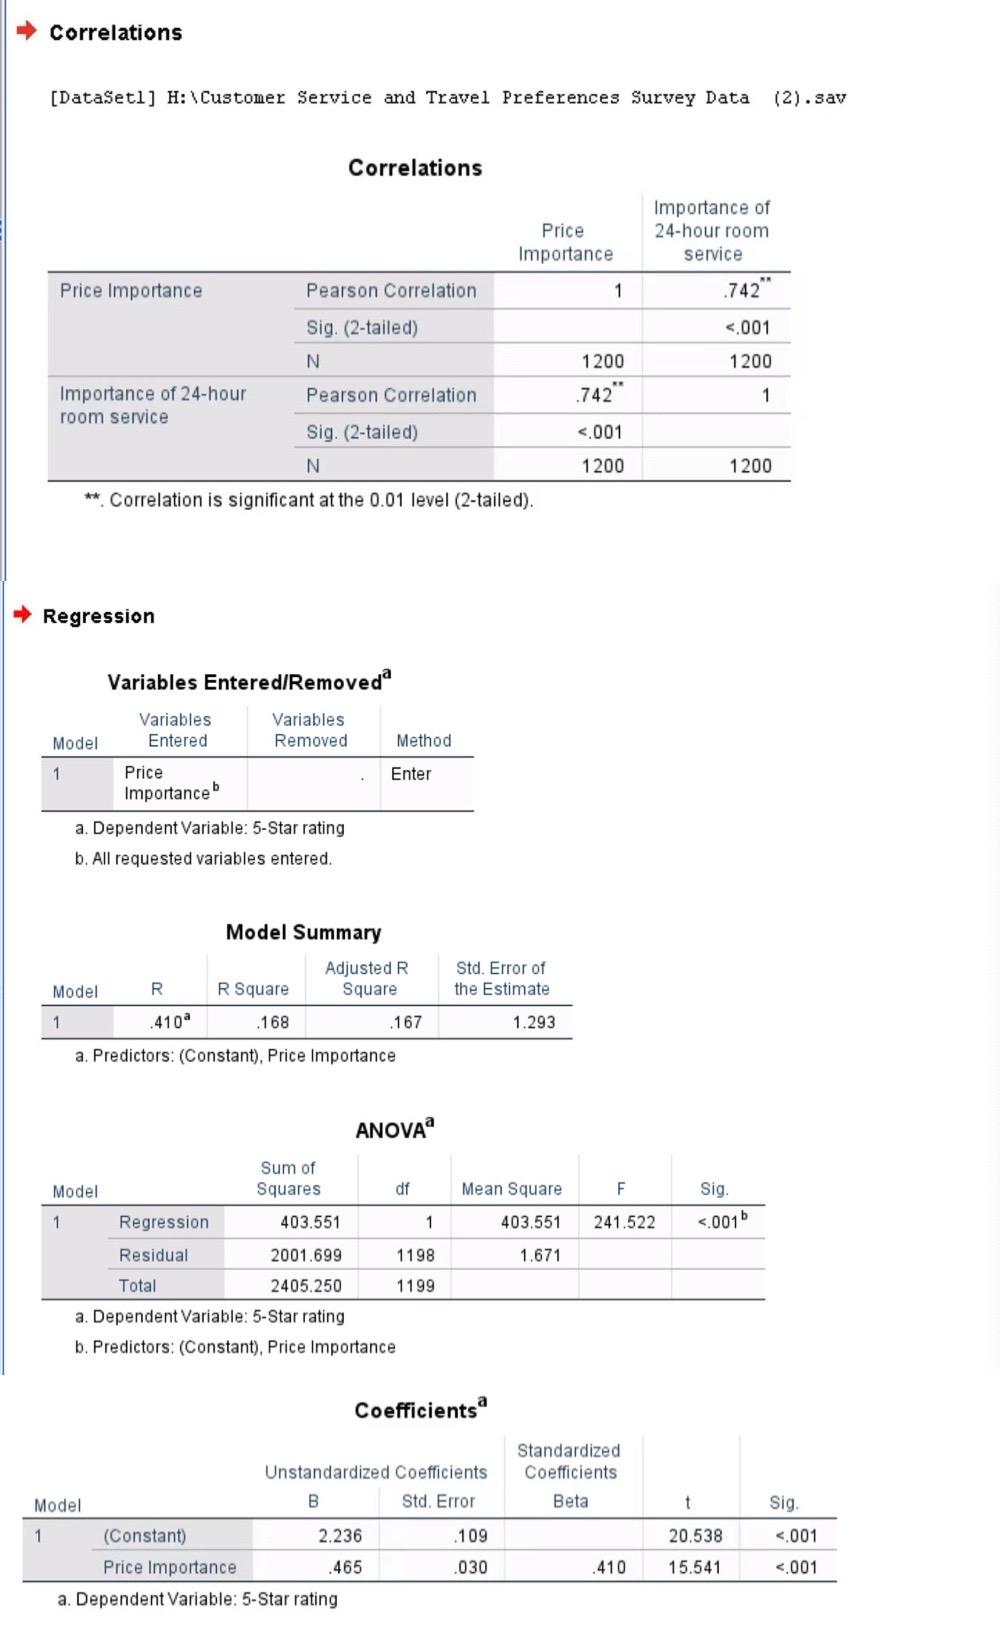
- Run a correlation analysis for PRICE by ROOMSERV. (10 points)
- Is the correlation significant or not? Explain why or why not. (1 point)
- What is the correlation? What is its strength (magnitude)? (2 points)
- What is the directionality of the correlation? Explain how the variables react to each other (do they travel together or go in opposite directions)? (2 point)
- In your own words, write up the results of this correlation analysis in your own words. Be sure to include the test statistic and p-value in your write-up. (5 points)
- Run a regression analysis for PRICE (Independent) by FIVESTAR (Dependent). (25 points)
- What is the Coefficient of Determination (R2) for the regression? How much of the variation in the Importance Rating for Five-Star Service is explained by Price Importance? (1 point)
- List the test statistic, df and p-value. Is the test statistically significant? (5 points)
- What is the Y-intercept? (2 points)
- What is the regression coefficient? (2 points)
- Using Excel, create a model using the linear regression equation provided by the regression analysis. What is the value of the five-star importance rating when price importance is rated 1, 3 or 5? (5 points)
-
- Using Excel, create a graph showing the linear association between the importance of price and five-star service rating. (5 points)
- In your own words, write up the results shown in your graph. (5 points)
Correlations [DataSetl] H:\Customer Service and Travel Preferences Survey Data (2).sav Correlations Price Importance Importance of 24-hour room service Price Importance Pearson Correlation 1 .742 <.001 sig. n .742 importance of room service pearson correlation is significant at the level regression variables entered removed model method enter price a. dependent variable: rating b. all requested entered. summary adjusted r square .168 .167 std. error estimate predictors: anova mean f sum squares df residual total coefficients a unstandardized b standardized beta t .109 .465 .030 .410 correlations h: and travel preferences survey data>
Step by Step Solution
There are 3 Steps involved in it

Get step-by-step solutions from verified subject matter experts