

Question: RUN ANOVA AND SPLIT PLOT WITH MICROSOFT EXCEL SPLIT PLOT EXPERIMENT An experiment was conducted to determine the eect of harvest stage on three varieties
RUN ANOVA AND SPLIT PLOT WITH MICROSOFT EXCEL
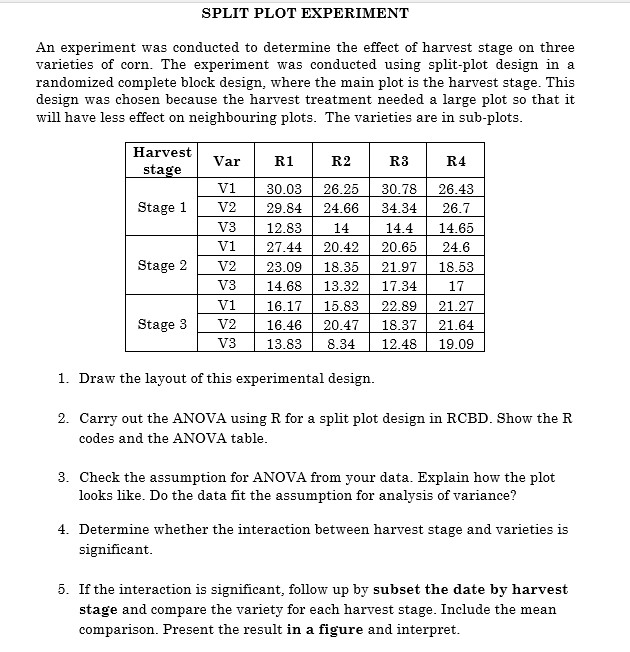
SPLIT PLOT EXPERIMENT An experiment was conducted to determine the e"ect of harvest stage on three varieties of corn. The experiment was conducted using split-plot design in a randomized complete block design, where the main plot is the harvest stage. This design was chosen because the harvest treatment needed a large plot so that it will have less e \"ect on neighbouring plots. The varieties are in sub-plots. Harvest- stage Var R1 R2 R3 R4 '71 30.03 26.25 30.78 26.43 Stage 1 V72 29.84 24.66 34.34 26.7 '73 12.83 14 14.4 14.65 V71 27.44 20.42 20.65 24.6 Stage 2 V72 23.09 18.35 21.97 18.53 V3 14.68 13.32 17.34 17 V71 16.17 15.83 22.89 21.27 Stage 3 '72- 16.48 20.47 18.37 21.64 '73 13.83 8.34 12.48 19.09 1. Draw the layout of this experimental design. 2. Carry out the ANOVA using R for a split plot design in RCBD. Show the R codes and the ANOVA table. 3. Check the assumption "or ANOVA from your data. Explain how the plot looks like. Do the data :it the assumption for analysis of variance? 4. Determine whether the interaction between harvest stage and varieties is signicant. pl If the interaction is significant, follow up by subset the date by harvest stage and compare the variety for each harvest stage. Include the mean comparison. Present the result in a figure and interpret
Step by Step Solution
There are 3 Steps involved in it

Get step-by-step solutions from verified subject matter experts