

Question: S 3 : Shown to the right are speed - time graphs for two carts that were involved in a collision similar to what you
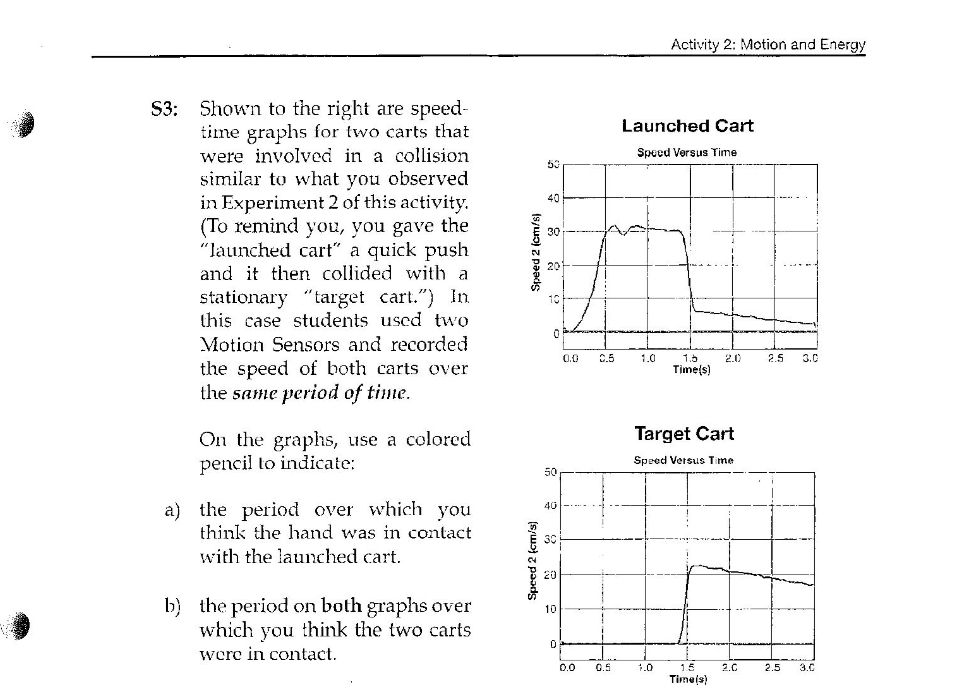
S: Shown to the right are speed
time graphs for two carts that
were involved in a collision
similar to what you observed
in Experiment of this activity.
To remind you, you gave the
"launched cart" a quick push
and it then collided with a
stationary "target cart." In
this case students used two
Motion Sensors and recorded
the speed of both carts over
the same period of time.
On the graphs, use a colored
pencil to indicate:
a the period over which you
think the hand was in contact
with the launched cart.
b the period on both graphs over
which you think the two carts
were in contact.
Step by Step Solution
There are 3 Steps involved in it
1 Expert Approved Answer
Step: 1 Unlock

Question Has Been Solved by an Expert!
Get step-by-step solutions from verified subject matter experts
Step: 2 Unlock
Step: 3 Unlock