

Question: Shown to the right are speed- time graphs for two carts that were involved in a collision similar to what you observed in Experiment
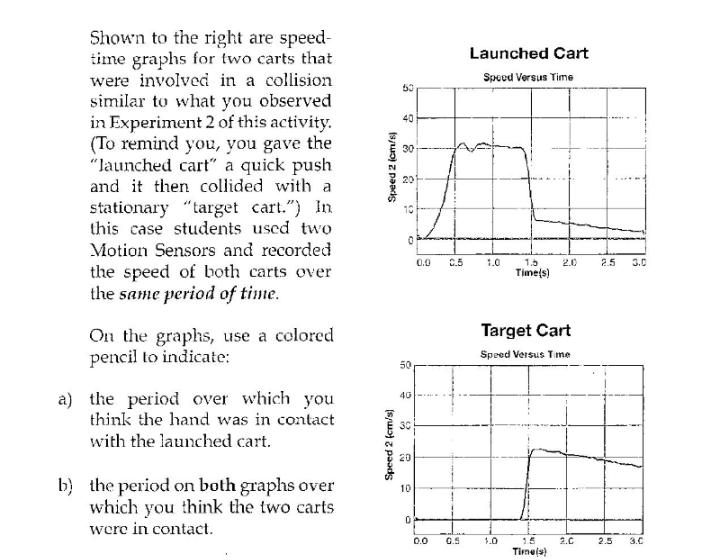
Shown to the right are speed- time graphs for two carts that were involved in a collision similar to what you observed in Experiment 2 of this activity. (To remind you, you gave the "launched cart" a quick push and it then collided with a stationary "target cart.") In this case students used two Motion Sensors and recorded the speed of both carts over the same period of time. On the graphs, use a colored pencil to indicate: a) the period over which you think the hand was in contact with the launched cart. b) the period on both graphs over which you think the two carts were in contact. 50 Speed 2 (cm/s) 40 Speed 2 (cm/s) 8 30 O 50 4 0.0 C.5 40 30 20 10 0 0.0 Launched Cart Speed Versus Time 0.5 1.0 1.5 2.0 Time(s) Target Cart Speed Versus Time 1.0 1.5 Time(s) 2.C 2.5 2.5 3.0 3.C
Step by Step Solution
3.47 Rating (157 Votes )
There are 3 Steps involved in it
Solutions Step 1 The speed kmh versus time s graph of the launched cart and target cart is given The ... View full answer

Get step-by-step solutions from verified subject matter experts