

Question: ? . . S 6 . 1 1 Twelve samples, each containing five parts, were taken from a process that produces steel rods at Emmanuel
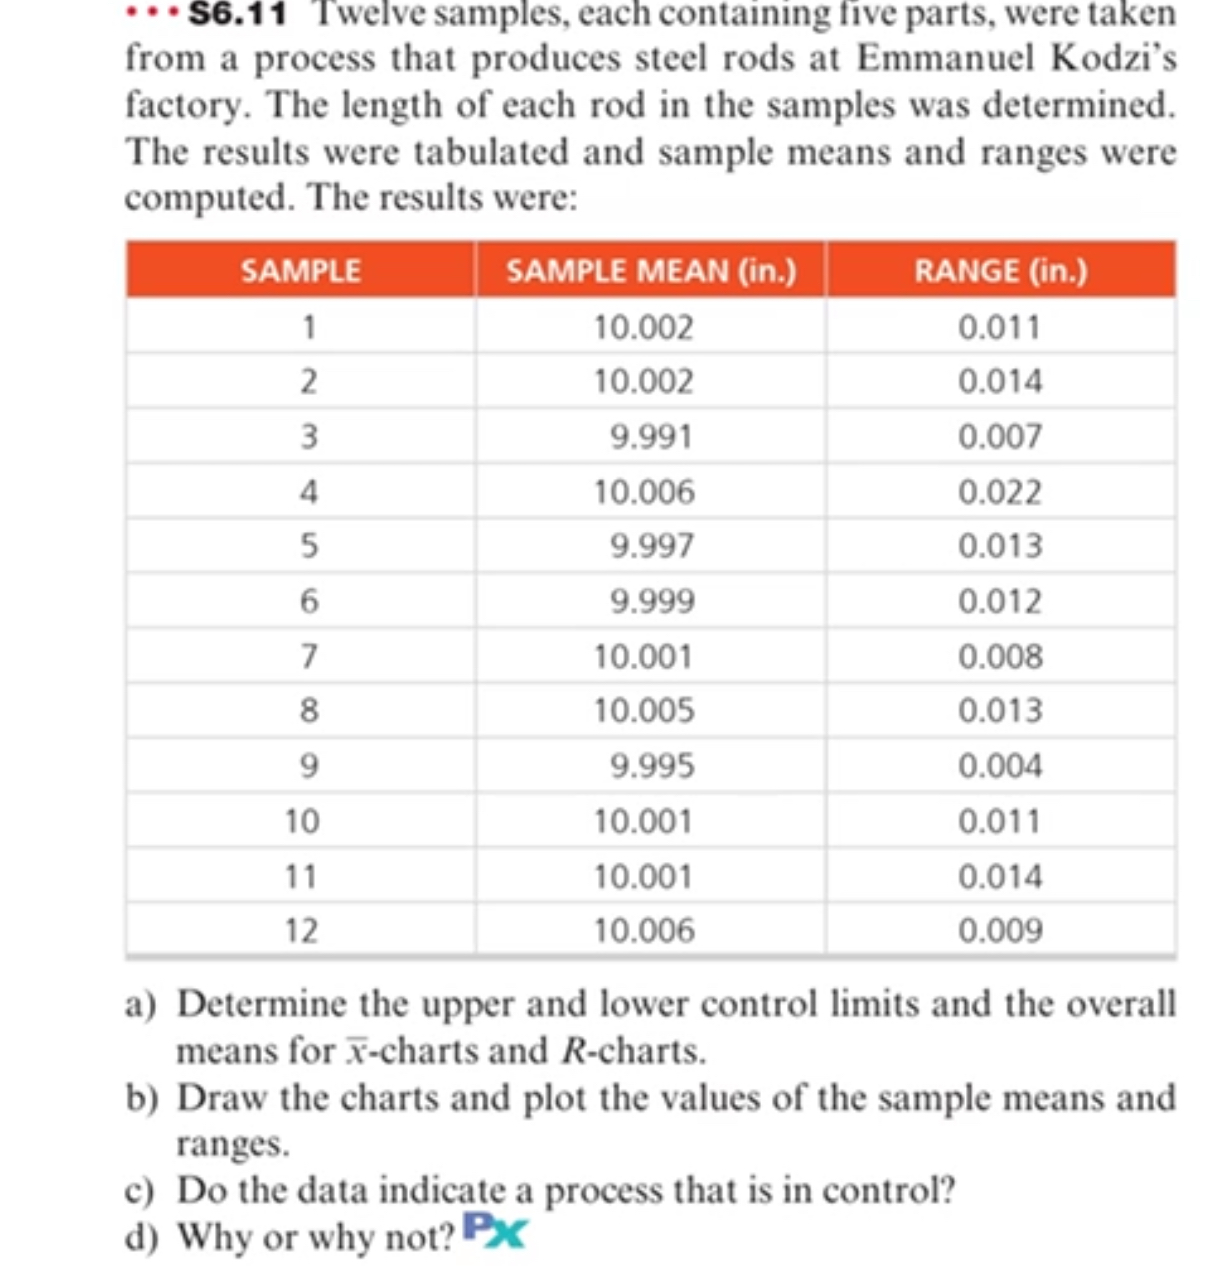
S Twelve samples, each containing five parts, were taken from a process that produces steel rods at Emmanuel Kodzi's factory. The length of each rod in the samples was determined. The results were tabulated and sample means and ranges were computed. The results were:
tableSAMPLESAMPLE MEAN inRANGE in
a Determine the upper and lower control limits and the overall means for charts and charts.
b Draw the charts and plot the values of the sample means and ranges.
c Do the data indicate a process that is in control?
d Why or why not?
Step by Step Solution
There are 3 Steps involved in it
1 Expert Approved Answer
Step: 1 Unlock

Question Has Been Solved by an Expert!
Get step-by-step solutions from verified subject matter experts
Step: 2 Unlock
Step: 3 Unlock