Question: s for Computing Control Chart Limits (3 sigma) for this problem. on-cut wire (to be used in computer assembly) every hour for the past 24
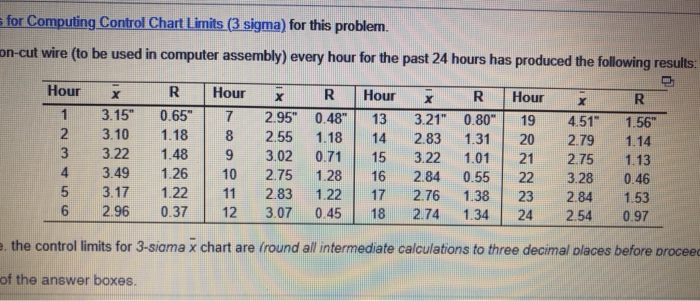
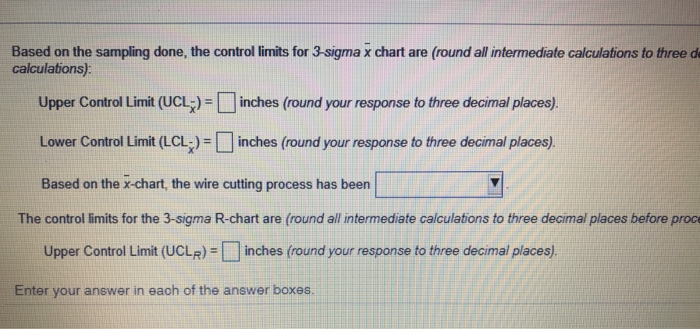
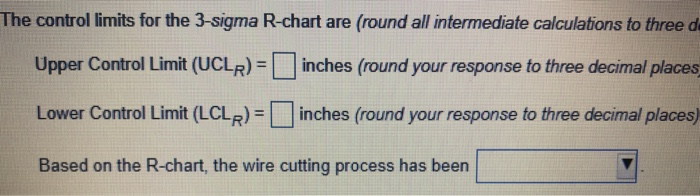
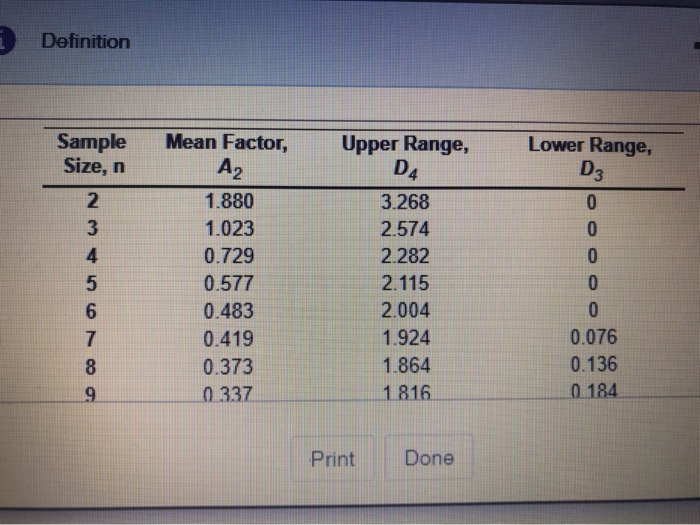
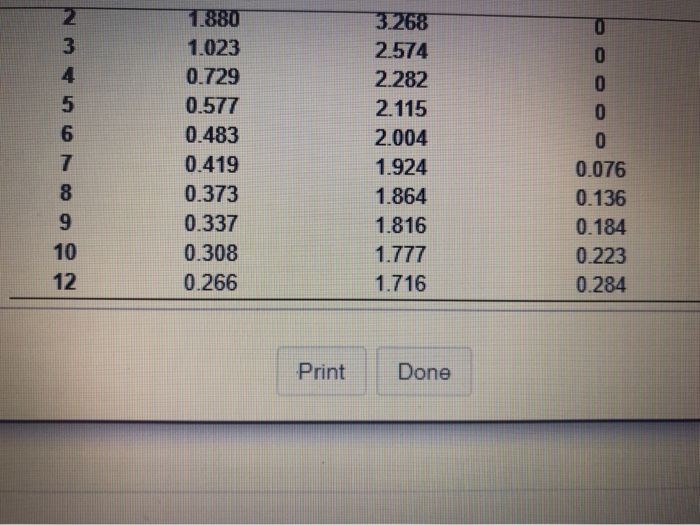
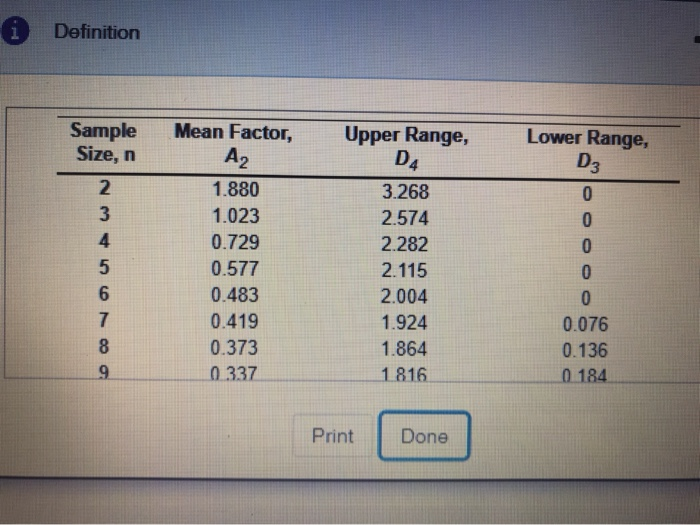
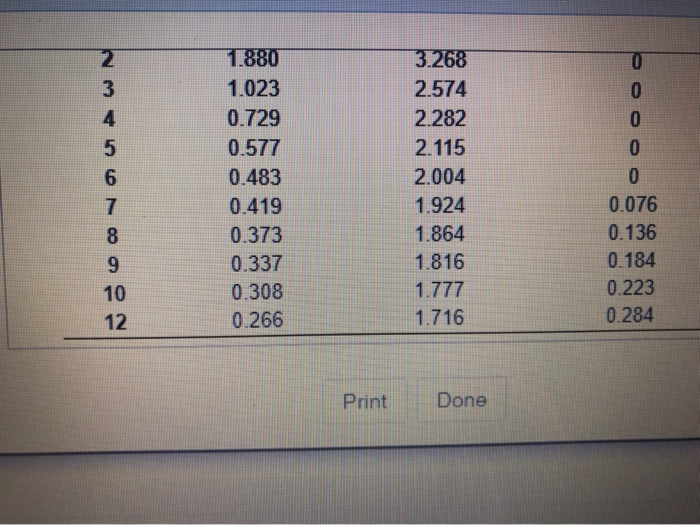
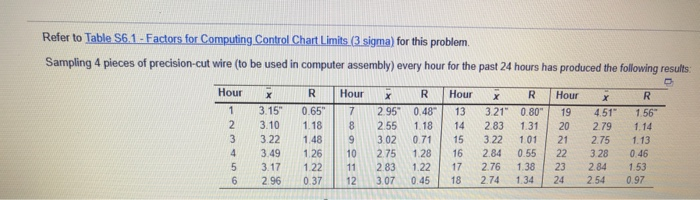
s for Computing Control Chart Limits (3 sigma) for this problem. on-cut wire (to be used in computer assembly) every hour for the past 24 hours has produced the following results: R Hour R Hour 1 2 3 7 3.15" 3.10 3.22 3.49 3.17 2.96 0.65" 1.18 1.48 1.26 1.22 0.37 8 9 10 11 12 2.95" 0.48" 2.55 1.18 3.02 0.71 2.75 1.28 2.83 1.22 3.07 0.45 Hour 13 14 15 16 17 18 x R 3.21" 0.80" 2.83 1.31 3.22 1.01 2.84 0.55 2.76 1.38 2.74 1.34 Hour 19 20 21 22 23 24 X 4.51 2.79 2.75 3.28 2.84 2.54 R 1.56" 1.14 1.13 0.46 1.53 0.97 5 6 e. the control limits for 3-siama x chart are (round all intermediate calculations to three decimal places before proceed of the answer boxes. Based on the sampling done, the control limits for 3-sigma x chart are (round all intermediate calculations to three de calculations): Upper Control Limit (UCL;) - inches (round your response to three decimal places). Lower Control Limit (LCL2) - inches (round your response to three decimal places). Based on the x-chart, the wire cutting process has been The control limits for the 3-sigma R-chart are (round all intermediate calculations to three decimal places before proce Upper Control Limit (UCLP) - inches (round your response to three decimal places), Enter your answer in each of the answer boxes. The control limits for the 3-sigma R-chart are (round all intermediate calculations to three d- inches (round your response to three decimal places Upper Control Limit (UCLR) = | Lower Control Limit (LCLR) = | inches (round your response to three decimal places) Based on the R-chart, the wire cutting process has been Definition Sample Size, n Upper Range, D4 2 3 4 5 6 7 8 9 Mean Factor, A2 1.880 1.023 0.729 0.577 0.483 0.419 0.373 3.268 2.574 2.282 2.115 2.004 1.924 1.864 1 816 Lower Range, D3 0 0 0 0 0 0.076 0.136 0184 0337 Print Done 2 3 4 5 0 0 0 6 1.880 1.023 0.729 0.577 0.483 0.419 0.373 0.337 0.308 0.266 3268 2.574 2.282 2.115 2.004 1.924 1.864 1.816 1.777 1.716 7 8 9 10 12 0 0.076 0.136 0.184 0.223 0.284 Print Done Definition Sample Size, n 2 3 4 5 6 7 8 9 Mean Factor, A2 1.880 1.023 0.729 0.577 0.483 0.419 0.373 0.337 Upper Range, D4 3.268 2.574 2.282 2.115 2.004 1.924 1.864 1816 Lower Range, D3 0 0 0 0 0 0.076 0.136 0 184 Print Done AWN 5 6 7 8 9 10 12 1.880 1.023 0.729 0.577 0.483 0.419 0.373 0.337 0.308 0.266 3.268 2.574 2.282 2.115 2.004 1.924 1.864 1.816 1.777 1.716 0 0 0 0 0 0.076 0.136 0.184 0.223 0.284 Print Done Refer to Table 56.1 Factors for Computing Control Chart Limits (3 sigma) for this problem Sampling 4 pieces of precision-cut wire to be used in computer assembly) every hour for the past 24 hours has produced the following results: Hour Hour R R 1 2 3 4 5 6 X 3.15" 3.10 3.22 3.49 3.17 2.96 R 0.65" 1.18 1.48 126 1.22 0.37 7 8 9 10 11 12 2.95 2.55 3.02 2.75 2.83 3.07 0.48 1.18 0.71 1.28 1.22 0.45 Hour 13 14 15 16 17 18 X R 3.21" 0.80" 2.83 1.31 3.22 1 01 2.84 0.55 2.76 1.38 2.74 134 Hour 19 20 21 22 23 24 4.51" 2.79 2.75 3.28 2.84 2.54 1.56 1.14 1.13 0.46 1.53 0.97 s for Computing Control Chart Limits (3 sigma) for this problem. on-cut wire (to be used in computer assembly) every hour for the past 24 hours has produced the following results: R Hour R Hour 1 2 3 7 3.15" 3.10 3.22 3.49 3.17 2.96 0.65" 1.18 1.48 1.26 1.22 0.37 8 9 10 11 12 2.95" 0.48" 2.55 1.18 3.02 0.71 2.75 1.28 2.83 1.22 3.07 0.45 Hour 13 14 15 16 17 18 x R 3.21" 0.80" 2.83 1.31 3.22 1.01 2.84 0.55 2.76 1.38 2.74 1.34 Hour 19 20 21 22 23 24 X 4.51 2.79 2.75 3.28 2.84 2.54 R 1.56" 1.14 1.13 0.46 1.53 0.97 5 6 e. the control limits for 3-siama x chart are (round all intermediate calculations to three decimal places before proceed of the answer boxes. Based on the sampling done, the control limits for 3-sigma x chart are (round all intermediate calculations to three de calculations): Upper Control Limit (UCL;) - inches (round your response to three decimal places). Lower Control Limit (LCL2) - inches (round your response to three decimal places). Based on the x-chart, the wire cutting process has been The control limits for the 3-sigma R-chart are (round all intermediate calculations to three decimal places before proce Upper Control Limit (UCLP) - inches (round your response to three decimal places), Enter your answer in each of the answer boxes. The control limits for the 3-sigma R-chart are (round all intermediate calculations to three d- inches (round your response to three decimal places Upper Control Limit (UCLR) = | Lower Control Limit (LCLR) = | inches (round your response to three decimal places) Based on the R-chart, the wire cutting process has been Definition Sample Size, n Upper Range, D4 2 3 4 5 6 7 8 9 Mean Factor, A2 1.880 1.023 0.729 0.577 0.483 0.419 0.373 3.268 2.574 2.282 2.115 2.004 1.924 1.864 1 816 Lower Range, D3 0 0 0 0 0 0.076 0.136 0184 0337 Print Done 2 3 4 5 0 0 0 6 1.880 1.023 0.729 0.577 0.483 0.419 0.373 0.337 0.308 0.266 3268 2.574 2.282 2.115 2.004 1.924 1.864 1.816 1.777 1.716 7 8 9 10 12 0 0.076 0.136 0.184 0.223 0.284 Print Done Definition Sample Size, n 2 3 4 5 6 7 8 9 Mean Factor, A2 1.880 1.023 0.729 0.577 0.483 0.419 0.373 0.337 Upper Range, D4 3.268 2.574 2.282 2.115 2.004 1.924 1.864 1816 Lower Range, D3 0 0 0 0 0 0.076 0.136 0 184 Print Done AWN 5 6 7 8 9 10 12 1.880 1.023 0.729 0.577 0.483 0.419 0.373 0.337 0.308 0.266 3.268 2.574 2.282 2.115 2.004 1.924 1.864 1.816 1.777 1.716 0 0 0 0 0 0.076 0.136 0.184 0.223 0.284 Print Done Refer to Table 56.1 Factors for Computing Control Chart Limits (3 sigma) for this problem Sampling 4 pieces of precision-cut wire to be used in computer assembly) every hour for the past 24 hours has produced the following results: Hour Hour R R 1 2 3 4 5 6 X 3.15" 3.10 3.22 3.49 3.17 2.96 R 0.65" 1.18 1.48 126 1.22 0.37 7 8 9 10 11 12 2.95 2.55 3.02 2.75 2.83 3.07 0.48 1.18 0.71 1.28 1.22 0.45 Hour 13 14 15 16 17 18 X R 3.21" 0.80" 2.83 1.31 3.22 1 01 2.84 0.55 2.76 1.38 2.74 134 Hour 19 20 21 22 23 24 4.51" 2.79 2.75 3.28 2.84 2.54 1.56 1.14 1.13 0.46 1.53 0.97