

Question: S o l v e t h e f o ll o w in g q u es t i o n s pl e

Solvethefollowingquestionsplease:
Questions.
Consider the Solow growth model with no technological progress and population growth rate n>0. Specifically, for simplicity of this question, assume that g=0 and At=1 at all times. However, suppose the economy has a fixed supply of land, denoted by Z, which is a third input in the aggregate production function. Let the aggregate production function be given by Yt=ZKtN1t with 0
In this economy...
Group of answer choices
the steady state level of output-per-capita is y=[sZn+]1. This implies that there is a steady state in which output-per-capita is increasing in the amount of land available for production. The reason for this is because land is spread out across the inputs and does not exhibit diminishing returns.
there is a steady state in which aggregate output grows at the rate Z+n. This is because there are increasing returns to production inputs when accounting for land as a productive input.
the steady state level of output-per-capita is y=[sZn+]1. The steady state growth rate of aggregate output increases with the amount of land used in production. The reason for this is because land affects the marginal product of labour and hence it magnifies the effect of population growth on the growth rate of aggregate output.
there does not exist a steady state in which aggregate output is constant, nor a state state in which output-per-capita is constant. This result obtains because the production function does not exhibit diminishing returns to land. Specifically, in this case, if land is doubled, aggregate output is doubled and hence, the marginal product of capital is doubled. This prevents diminishing returns to capital inputs from choking off investment as the returns to investment will always exceed the effective depreciation rate on capital-per-worker


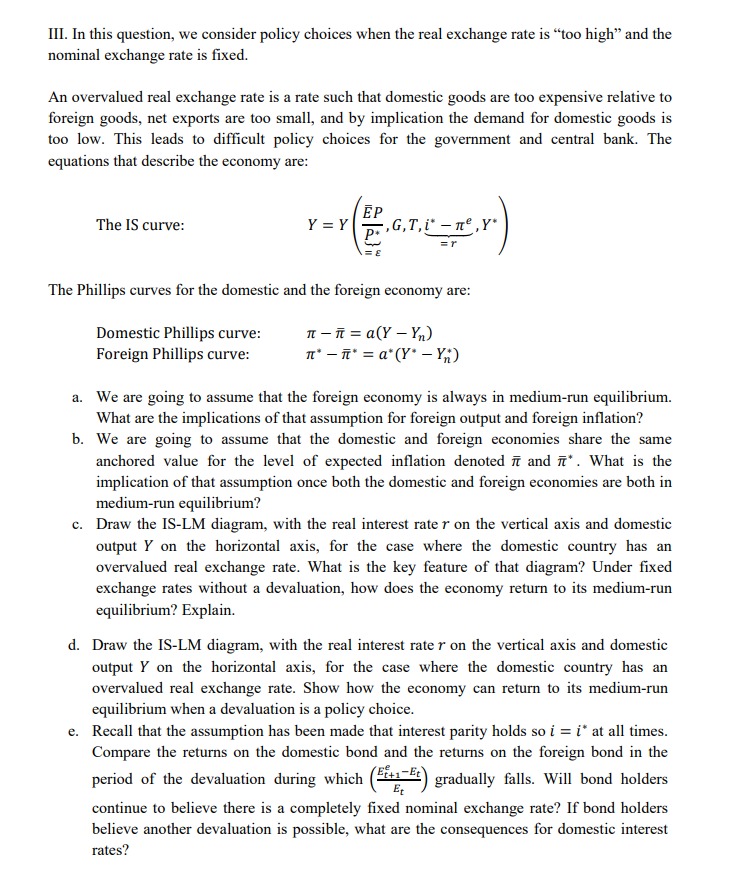
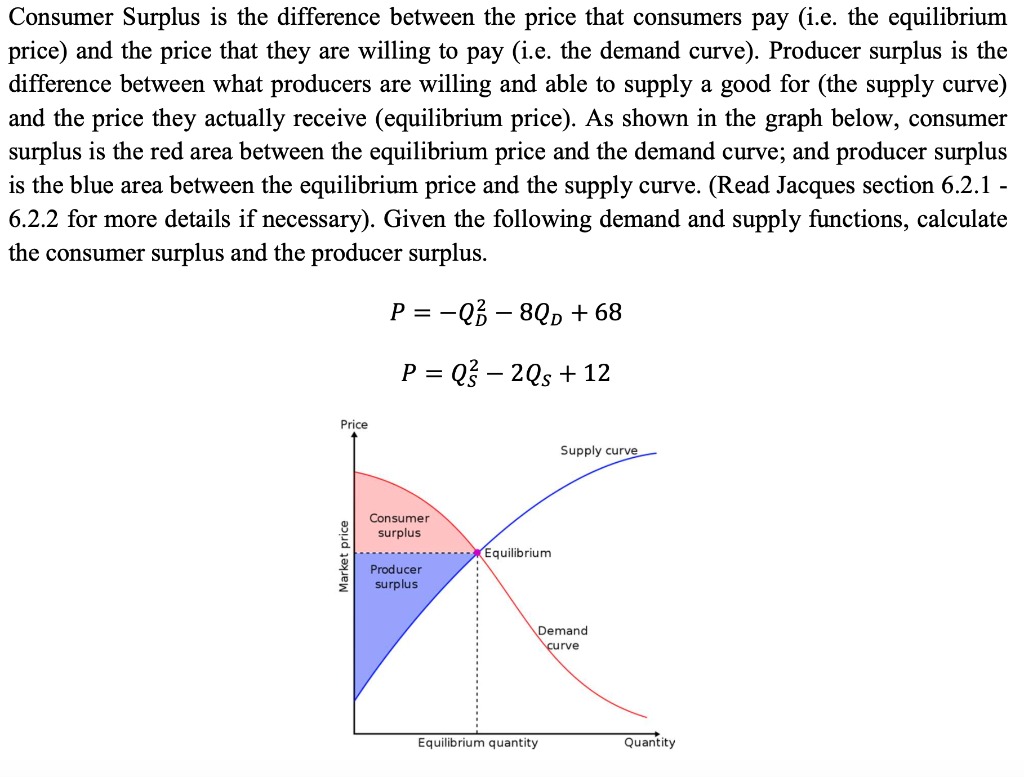
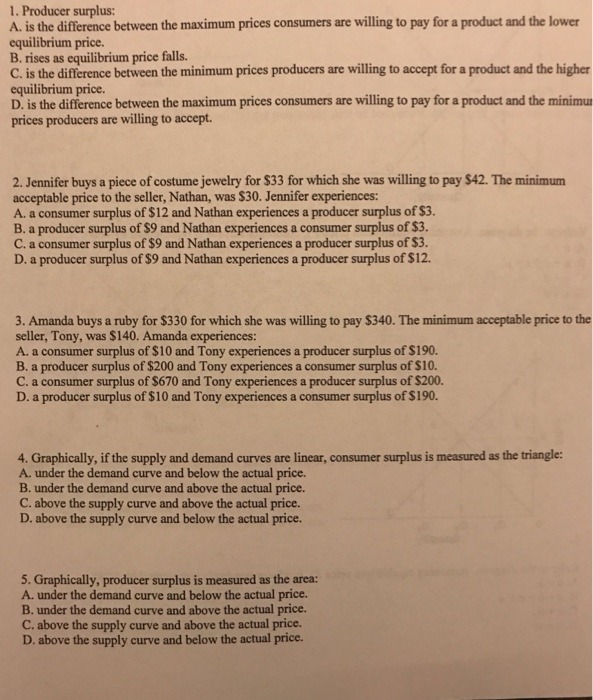
Consumer Surplus is the difference between the price that consumers pay (i.e. the equilibrium price) and the price that they are willing to pay (Le. the demand curve). Producer surplus is the difference between what producers are willing and able to supply a good for (the supply curve) and the price they actually receive (equilibrium price). As shown in the graph below, consumer surplus is the red area between the equilibrium price and the demand curve; and producer surplus is the blue area between the equilibrium price and the supply curve. (Read Jacques section 6.2.1 - 6.2.2 for more details if necessary). Given the following demand and supply functions, calculate the consumer surplus and the producer surplus. P=Qg3QD+63 P=Q2Q5+12 Equilibrium quantity 1. Producer surplus: A. is the difference between the maximum prices consumers are willing to pay for a product and the lower equilibrium price. B. rises as equilibrium price falls. C. is the difference between the minimum prices producers are willing to accept for a product and the higher equilibrium price. D. is the difference between the maximum prices consumers are willing to pay for a product and the minimum prices producers are willing to accept. 2. Jennifer buys a piece of costume jewelry for $33 for which she was willing to pay $42. The minimum acceptable price to the seller, Nathan, was $30. Jennifer experiences: A. a consumer surplus of $12 and Nathan experiences a producer surplus of $3. B. a producer surplus of $9 and Nathan experiences a consumer surplus of $3. C. a consumer surplus of $9 and Nathan experiences a producer surplus of $3. D. a producer surplus of $9 and Nathan experiences a producer surplus of $12. 3. Amanda buys a ruby for $330 for which she was willing to pay $340. The minimum acceptable price to the seller, Tony, was $140. Amanda experiences: A. a consumer surplus of $10 and Tony experiences a producer surplus of $190. B. a producer surplus of $200 and Tony experiences a consumer surplus of $10. C. a consumer surplus of $670 and Tony experiences a producer surplus of $200. D. a producer surplus of $10 and Tony experiences a consumer surplus of $190. 4. Graphically, if the supply and demand curves are linear, consumer surplus is measured as the triangle: A. under the demand curve and below the actual price. B. under the demand curve and above the actual price. C. above the supply curve and above the actual price. D. above the supply curve and below the actual price. 5. Graphically, producer surplus is measured as the area: A. under the demand curve and below the actual price. B. under the demand curve and above the actual price. C. above the supply curve and above the actual price. D. above the supply curve and below the actual price.III. In this question, we consider policy choices when the real exchange rate is \"too high\" and the nominal exchange rate is fixed. An overvalued real exchange rate is a rate such that domestic goods are too expensive relative to foreign goods, net exports are too small, and by implication the demand for domestic goods is too low. This leads to difficult policy choices for the government and central hank. The equations that describe the economy are: EP TheIS curve: Y=Y F,G,T.i'rr\
Step by Step Solution
There are 3 Steps involved in it

Get step-by-step solutions from verified subject matter experts