

Question: S S $ (Amounts in millions, except per share data) Net sales Cost of goods sold Gross profit Operating expenses Operating earnings before financial services
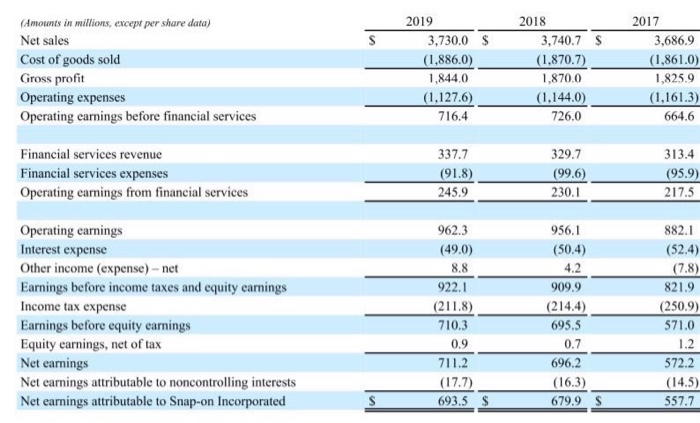
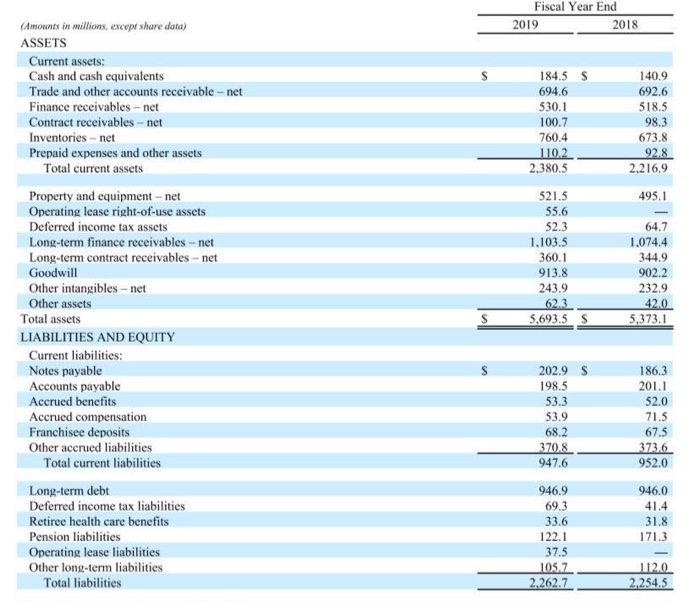
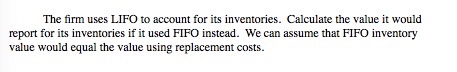
S S $ (Amounts in millions, except per share data) Net sales Cost of goods sold Gross profit Operating expenses Operating earnings before financial services 2019 3,730.0 (1.886.0) 1,844.0 (1.127.6) 716.4 2018 3,740.7 (1.870.7) 1,870.0 (1.144.0) 726.0 2017 3,686.9 (1,861.0) 1,825.9 (1,161.3) 664.6 Financial services revenue Financial services expenses Operating earnings from financial services 337.7 (91.8) 245.9 329.7 (99.6) 230.1 313.4 (95.9) 217.5 Operating earnings Interest expense Other income (expense) - net Earnings before income taxes and equity earnings Income tax expense Earnings before equity earnings Equity earnings, net of tax Net earnings Net earnings attributable to noncontrolling interests Net earnings attributable to Snap-on Incorporated 962.3 (49.0) 8.8 922.1 (211.8) 710.3 956.1 (50.4) 4.2 909.9 (214.4) 695.5 0.7 696,2 (16.3) 679.9 882.1 (52.4) (7.8) 821.9 (250.9) 571.0 1.2 572.2 0.9 711.2 (17.7) 693.5 (14.5) 557.7 $ $ Fiscal Year End 2019 2018 S (Amounts in millions, excepe share data) ASSETS Current assets: Cash and cash equivalents Trade and other accounts receivable -net Finance receivables - net Contract receivables - net Inventories - net Prepaid expenses and other assets Total current assets 184.5 694.6 530.1 100.7 760.4 110.2 2,380.5 140.9 692.6 518.5 98.3 673.8 92.8 2.216.9 495.1 521.5 55.6 52.3 1.103.5 360.1 913.8 243.9 64.7 1,074.4 344.9 902.2 232.9 42.0 5,373.1 5,693.5 S Property and equipment-net Operating lease right-of-use assets Deferred income tax assets Long-term finance receivables-net Long-term contract receivables-net Goodwill Other intangibles - net Other assets Total assets LIABILITIES AND EQUITY Current liabilities: Notes payable Accounts payable Accrued benefits Accrued compensation Franchisee deposits Other accrued liabilities Total current liabilities S 202.9 198.5 53.3 53.9 68.2 370.8 947.6 186.3 2011 52.0 71.5 67.5 373.6 952.0 Long-term debt Deferred income tax liabilities Retiree health care benefits Pension liabilities Operating lease liabilities Other long-term liabilities Total liabilities 946.9 69.3 33.6 122.1 37.5 105.7. 946.0 41.4 31.8 171.3 2.262.2 112.0 2.254.5 - The firm uses LIFO to account for its inventories. Calculate the value it would report for its inventories if it used FIFO instead. We can assume that FIFO inventory value would equal the value using replacement costs. S S $ (Amounts in millions, except per share data) Net sales Cost of goods sold Gross profit Operating expenses Operating earnings before financial services 2019 3,730.0 (1.886.0) 1,844.0 (1.127.6) 716.4 2018 3,740.7 (1.870.7) 1,870.0 (1.144.0) 726.0 2017 3,686.9 (1,861.0) 1,825.9 (1,161.3) 664.6 Financial services revenue Financial services expenses Operating earnings from financial services 337.7 (91.8) 245.9 329.7 (99.6) 230.1 313.4 (95.9) 217.5 Operating earnings Interest expense Other income (expense) - net Earnings before income taxes and equity earnings Income tax expense Earnings before equity earnings Equity earnings, net of tax Net earnings Net earnings attributable to noncontrolling interests Net earnings attributable to Snap-on Incorporated 962.3 (49.0) 8.8 922.1 (211.8) 710.3 956.1 (50.4) 4.2 909.9 (214.4) 695.5 0.7 696,2 (16.3) 679.9 882.1 (52.4) (7.8) 821.9 (250.9) 571.0 1.2 572.2 0.9 711.2 (17.7) 693.5 (14.5) 557.7 $ $ Fiscal Year End 2019 2018 S (Amounts in millions, excepe share data) ASSETS Current assets: Cash and cash equivalents Trade and other accounts receivable -net Finance receivables - net Contract receivables - net Inventories - net Prepaid expenses and other assets Total current assets 184.5 694.6 530.1 100.7 760.4 110.2 2,380.5 140.9 692.6 518.5 98.3 673.8 92.8 2.216.9 495.1 521.5 55.6 52.3 1.103.5 360.1 913.8 243.9 64.7 1,074.4 344.9 902.2 232.9 42.0 5,373.1 5,693.5 S Property and equipment-net Operating lease right-of-use assets Deferred income tax assets Long-term finance receivables-net Long-term contract receivables-net Goodwill Other intangibles - net Other assets Total assets LIABILITIES AND EQUITY Current liabilities: Notes payable Accounts payable Accrued benefits Accrued compensation Franchisee deposits Other accrued liabilities Total current liabilities S 202.9 198.5 53.3 53.9 68.2 370.8 947.6 186.3 2011 52.0 71.5 67.5 373.6 952.0 Long-term debt Deferred income tax liabilities Retiree health care benefits Pension liabilities Operating lease liabilities Other long-term liabilities Total liabilities 946.9 69.3 33.6 122.1 37.5 105.7. 946.0 41.4 31.8 171.3 2.262.2 112.0 2.254.5 - The firm uses LIFO to account for its inventories. Calculate the value it would report for its inventories if it used FIFO instead. We can assume that FIFO inventory value would equal the value using replacement costs
Step by Step Solution
There are 3 Steps involved in it

Get step-by-step solutions from verified subject matter experts