

Question: S11 Lab Data Visualization As we have learned, once the data has been extracted from the database, it is used to make decisions. Often, the
S11 Lab Data Visualization As we have learned, once the data has been extracted from the database, it is used to make decisions. Often, the decisions can be make quick and easily if the information is in a format to quickly review. Many managers and executives like to see a visualization of the data so decisions can be made without taking too much time. You will use the following vacation data from session 8 to help create a visual of the data. Using the output from your research in session 8, create a chart, a line graph or bar chart would be best for this lab. You should make any corrections to the session 8 lab as recommended by the instructor before continuing this lab. The chart should contain the data from all three years and all five locations. This visual representation should make the decision making process easier and even nice to view. For submission, using a spreadsheet, simply list the three locations, the data for the five days selected and for each location, and the actual location selection for vacation based on your analysis. The reading for this session will help you prepare this assignment, please read the material before attempting the lab.
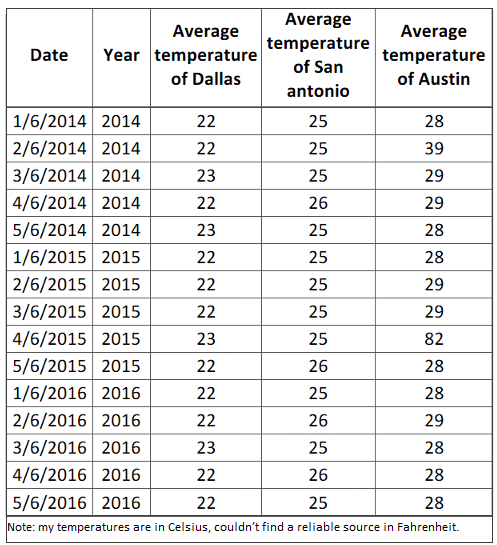
Average Average Average temperature temperature Date Year temperature of San of Dallas antonio of Austin 1/6/2014 2014 28 22 25 22 25 2/6/2014 2014 39 23 3/6/2014 2014 25 29 4/6/2014 2014 22 26 29 5/6/2014 2014 23 25 28 28 1/6/2015 2015 22 25 22 25 29 2/6/2015 2015 22 3/6/2015 2015 25 29 82 4/6/2015 2015 25 23 5/6/2015 2015 22 26 28 28 1/6/2016 2016 22 25 22 26 29 2/6/2016 2016 3/6/2016 2016 25 23 28 22 26 4/6/2016 2016 28 25 5/6/2016 2016 22 28 Note: my temperatures are in Celsius, couldn't find a reliable source in Fahrenheit. Average Average Average temperature temperature Date Year temperature of San of Dallas antonio of Austin 1/6/2014 2014 28 22 25 22 25 2/6/2014 2014 39 23 3/6/2014 2014 25 29 4/6/2014 2014 22 26 29 5/6/2014 2014 23 25 28 28 1/6/2015 2015 22 25 22 25 29 2/6/2015 2015 22 3/6/2015 2015 25 29 82 4/6/2015 2015 25 23 5/6/2015 2015 22 26 28 28 1/6/2016 2016 22 25 22 26 29 2/6/2016 2016 3/6/2016 2016 25 23 28 22 26 4/6/2016 2016 28 25 5/6/2016 2016 22 28 Note: my temperatures are in Celsius, couldn't find a reliable source in Fahrenheit
Step by Step Solution
There are 3 Steps involved in it

Get step-by-step solutions from verified subject matter experts