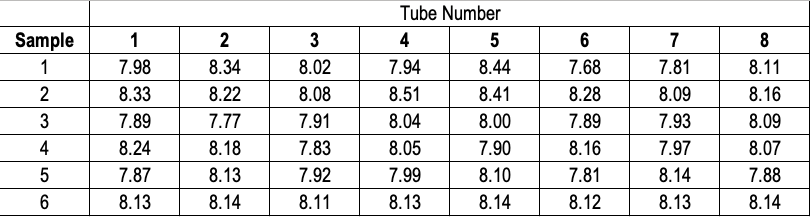
Question: Sample 1 2 3 4 5 6 IN 1 7.98 8.33 7.89 8.24 7.87 8.13 2 8.34 8.22 7.77 8.18 8.13 8.14 3 8.02 8.08

Sample 1 2 3 4 5 6 IN 1 7.98 8.33 7.89 8.24 7.87Sample 1 2 3 4 5 6 IN 1 7.98 8.33 7.89 8.24 7.87

Sample 1 2 3 4 5 6 IN 1 7.98 8.33 7.89 8.24 7.87 8.13 2 8.34 8.22 7.77 8.18 8.13 8.14 3 8.02 8.08 7.91 7.83 7.92 8.11 Tube Number 4 5 7.94 8.44 8.51 8.41 8.04 8.00 8.05 7.90 7.99 8.10 8.13 8.14 6 7.68 8.28 7.89 8.16 7.81 8.12 7 7.81 8.09 7.93 7.97 8.14 8.13 8 8.11 8.16 8.09 8.07 7.88 8.14 6 pp.127-128, #7: [Homework] Webster Chemical Company produces mastics and caulking for the construction industry. The product is blended in large mixers and then pumped into tubes and capped. Management is concerned about whether the filling process for tubes of caulking is in statistical control. The process should be centered on 8 ounces per tube. Several samples of eight tubes were taken, each tube was weighed, and the weights in Table 3.3 were obtained. [Table 3.3: See an Excel file] a. Assume that only six samples are sufficient and develop the control charts for the mean and the range. b. Plot the observations on the control chart and comment on your findings

Step by Step Solution

There are 3 Steps involved in it

1 Expert Approved Answer
Step: 1 Unlock blur-text-image
Question Has Been Solved by an Expert!

Get step-by-step solutions from verified subject matter experts

Step: 2 Unlock
Step: 3 Unlock

Students Have Also Explored These Related General Management Questions!