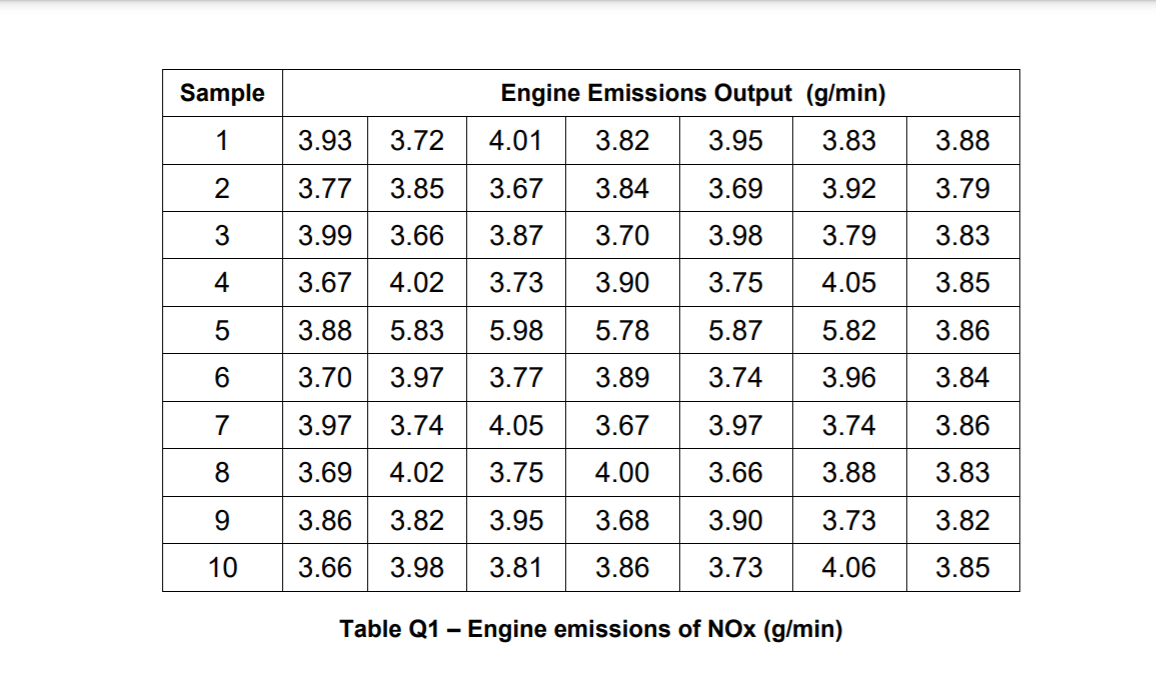
Question: Sample 1 3.93 3.72 3.88 2 3.77 3.85 3.79 3 3.99 3.66 3.83 4 3.67 4.02 3.85 5 3.88 Engine Emissions Output (g/min) 4.01 3.82

Sample 1 3.93 3.72 3.88 2 3.77 3.85 3.79 3 3.99Sample 1 3.93 3.72 3.88 2 3.77 3.85 3.79 3 3.99Sample 1 3.93 3.72 3.88 2 3.77 3.85 3.79 3 3.99Sample 1 3.93 3.72 3.88 2 3.77 3.85 3.79 3 3.99Sample 1 3.93 3.72 3.88 2 3.77 3.85 3.79 3 3.99Sample 1 3.93 3.72 3.88 2 3.77 3.85 3.79 3 3.99

Sample 1 3.93 3.72 3.88 2 3.77 3.85 3.79 3 3.99 3.66 3.83 4 3.67 4.02 3.85 5 3.88 Engine Emissions Output (g/min) 4.01 3.82 3.95 3.83 3.67 3.84 3.69 3.92 3.87 3.70 3.98 3.79 3.73 3.90 3.75 4.05 5.98 5.78 5.87 5.82 3.77 3.89 3.74 3.96 4.05 3.67 3.97 3.74 3.75 4.00 3.66 3.88 3.95 3.68 3.90 3.73 3.81 3.86 3.73 4.06 5.83 3.97 3.86 6 3.70 3.84 7 3.97 3.74 3.86 3.83 8 3.69 4.02 9 3.86 3.82 3.82 10 3.66 3.98 3.85 Table Q1 Engine emissions of NOx (g/min) x-bar engine 1 (3.93 + 3.72 +4.01 +3.82 + 3.95 + 3.83 + 3.88)/7 = 3.33 R=0.29 x-bar engine 2 (3.77 + 3.85 + 3.67 +3.84 +3.69 + 3.92 + 3.79)/7=3.79 R= 0.25 x-bar engine 3(3.99 + 3.66 + 3.87 +3.70 + 3.98 +3.79 +3.83)/7=3.83 R= 0.33 x-bar engine 4(3.67 +4.02 +3.73 + 3.90 +3.75 +4.05 +3.85)/7=3.85 R= 0.38 x-bar engine 5(3.88 +5.83+ 5.98 +5.78 +5.87+ 5.82+ 3.86)/7=5.29 R= 2.12 x-bar engine 6(3.70+ 3.97 + 3.77+ 3.89+ 3.74+ 3.96+ 3.84)/7=3.84 R=0.27 engine 7(3.97 +3.74+ 4.05+ 3.67 +3.97 +3.74+ 3.86)/7=3.86 R=0.38 x-bar engine 8(3.69+ 4.02 +3.75+4.00+ 3.66 +3.88 +3.83)/7=3.83 R=0.36 x-bar engine 9(3.86 +3.82+ 3.95 +3.68+ 3.90+ 3.73+ 3.82)/7=3.82 R=0.27 x-bar engine 10(3.66+ 3.98 +3.81 +3.86+ 3.73 +4.06 +3.85)/7=3.85 R=0.4 Sample size(n) = 7 A2=0.419 D3= 0.076 D4 = 1.924 Average for x = (3.33+3.79+3.83+3.85+5.29+3.84+3.86+3.83+3.82+3.85)/10 = 3.929 Average for R=(0.29+0.25+0.33+0.38+2.12+0.27+0.38+0.36+0.27+0.4)/10 = 0.505 Chart Area X-bar chart limits UCLx = + A2* = 4.141 CLE 3.929 LCLx = - Az* = 3.717 R-chart limits UCLR = D4* = 0.972 Cha=0.505 LCLR = D3* = 0.038 APPENDIX A n A2 1.880 D4 3.267 2 3 4 5 D3 0.000 0.000 0.000 0.000 0.000 0.076 0.136 0.184 0.223 1.023 0.729 0.577 0.483 0.419 0.373 0.337 0.308 6 7 d2 1.128 1.693 2.059 2.326 2.534 2.704 2.847 2.970 3.078 2.574 2.282 2.115 2.004 1.924 1.864 1.816 1.777 9 10 X Control Charts CL = X UCL = X + A2R LCL = X - AR Range Charts b) Plot the X and Range charts and hence determine if the process is in control (10marks)

Step by Step Solution

There are 3 Steps involved in it

1 Expert Approved Answer
Step: 1 Unlock blur-text-image
Question Has Been Solved by an Expert!

Get step-by-step solutions from verified subject matter experts

Step: 2 Unlock
Step: 3 Unlock

Students Have Also Explored These Related General Management Questions!