

Question: Sample Data 2:21: (mm) 216 Chinstrap 189 Adelie 184 Chinstrap 195 Chinstrap 2900 187 Gentoo 4200 210 Adelie 2850 181 Researchers studying penguins are interested

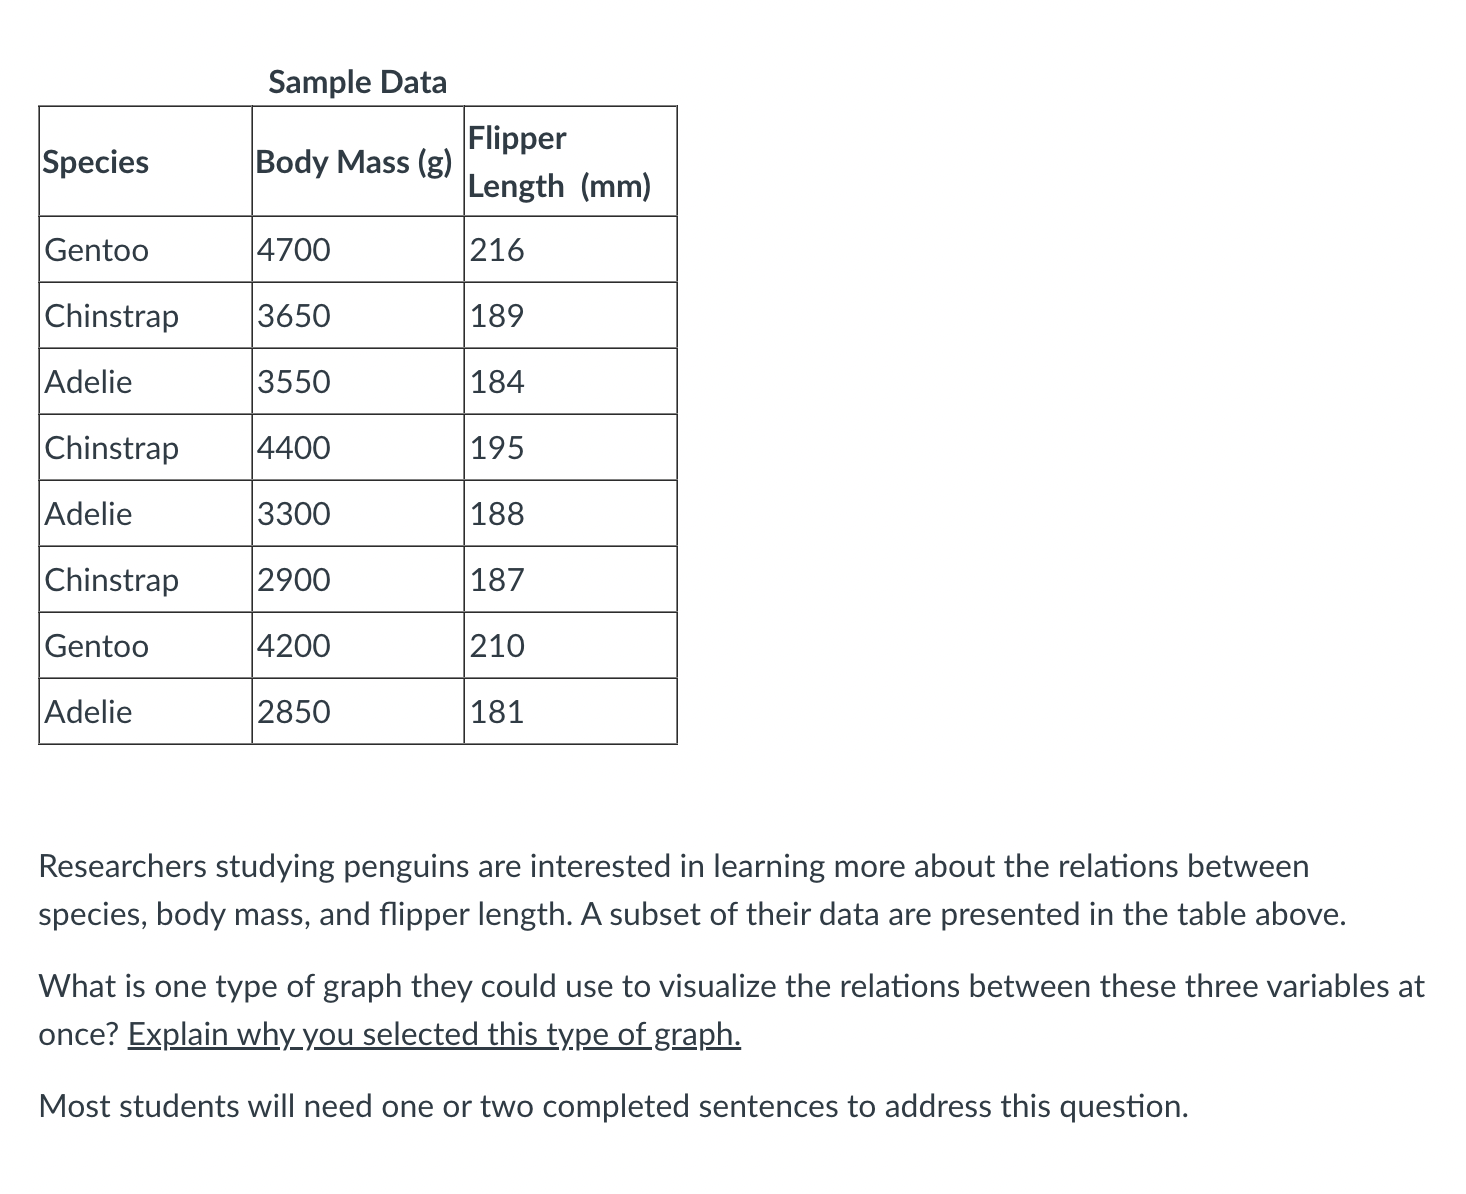
Sample Data 2:21: (mm) 216 Chinstrap 189 Adelie 184 Chinstrap 195 Chinstrap 2900 187 Gentoo 4200 210 Adelie 2850 181 Researchers studying penguins are interested in learning more about the relations between species, body mass, and ipper length. A subset of their data are presented in the table above. What is one type of graph they could use to visualize the relations between these three variables at once? plain why_you selected this type of ggm Most students will need one or two completed sentences to address this
Step by Step Solution
There are 3 Steps involved in it
1 Expert Approved Answer
Step: 1 Unlock

Question Has Been Solved by an Expert!
Get step-by-step solutions from verified subject matter experts
Step: 2 Unlock
Step: 3 Unlock