

Question: sample of Census File: PYTHON TEMPLATE: def main(): # create an empty dictionary pop_freq = {} # initialize the dictionary pop_freq ['1'] = 0 #
sample of Census File:
![empty dictionary pop_freq = {} # initialize the dictionary pop_freq ['1'] =](https://dsd5zvtm8ll6.cloudfront.net/si.experts.images/questions/2024/09/66f3da7e20268_21366f3da7d6f532.jpg)
PYTHON TEMPLATE:
def main(): # create an empty dictionary pop_freq = {} # initialize the dictionary pop_freq ['1'] = 0 # fill the rest pop_freq ['9'] = 0 # open file for reading in_file = open ("./Census_2009.txt", "r") # read the header and ignore header = in_file.readline() # read subsequent lines for line in in_file: line = line.strip() pop_data = line.split() # get the last element that is the population number pop_num = pop_data[-1] # make entries in the dictionary # close the file in_file.close() # write out the result main() USING PYTHON 3.6.1
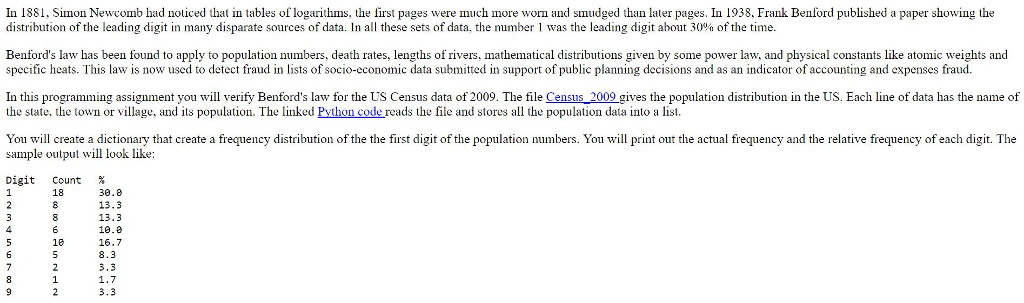
In 1881, Simon Newcomb had noticed that in tables of logarithms, the first pages were much more worn and smudged than later pages. In 1938. Frank Benford published a paper showing the distribution of the leading digit in many disparate sources of data. In all these sets of data, the number 1 was the leading digit about 30% of the time. Benford's law has been found to apply to population numbers, death rates, lengths of rivers, mathematical distributions given by some power Law. and physical constants like atomic weights and specific heats. This law is now- used to detect fraud in lists of socio-economic data submitted in support of public planning decisions and as an indicator of accounting and expenses fraud. In this programming assignment you will verify Benford's law for the US Census data of 2009. The file Census 2009 gives the population distribution in the US. Each line of data has the name of the state, the town or village, and its population. The linked Python code reads the file and stores all the population data into a list. You will create a dictionary that create a frequency distribution of the the first digit of the population numbers. You will print out the actual frequency and the relative frequency of each digit. The sample output will look like; Digit Count % 1 18 30.0 2 8 13.3 3 8 13.3 4 6 10.0 5 10 16.7 6 5 8.3 7 2 3.3 8 1 1.7 9 2 3.3
Step by Step Solution
There are 3 Steps involved in it

Get step-by-step solutions from verified subject matter experts