

Question: Sample Quantiles 40 -40 -20 0 20 20 6) Match the q-q plots on the next page with the appropriate letter: (A) skewed left
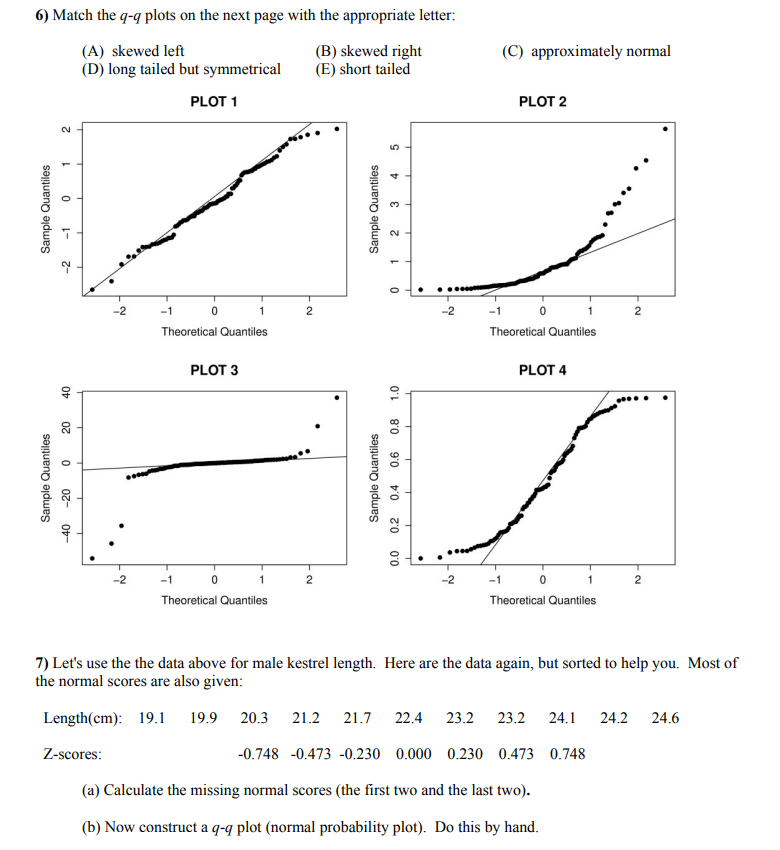
Sample Quantiles 40 -40 -20 0 20 20 6) Match the q-q plots on the next page with the appropriate letter: (A) skewed left (D) long tailed but symmetrical (B) skewed right (E) short tailed (C) approximately normal Sample Quantiles 1- 0 1 2 2- -2 -1 PLOT 1 -2 -1 0 1 2 Theoretical Quantiles 0 PLOT 3 Theoretical Quantiles 1 2 0.2 0.4 0.6 0.8 1.0 Sample Quantiles 00 0.0 2 Sample Quantiles L 0 3 4 5 -2 -1 PLOT 2 Theoretical Quantiles PLOT 4 -1 0 1 2 Theoretical Quantiles 1 2 7) Let's use the the data above for male kestrel length. Here are the data again, but sorted to help you. Most of the normal scores are also given: Length(cm): 19.1 19.9 20.3 21.2 21.7 22.4 23.2 23.2 24.1 Z-scores: -0.748 -0.473 -0.230 0.000 0.230 0.473 0.748 (a) Calculate the missing normal scores (the first two and the last two). (b) Now construct a q-q plot (normal probability plot). Do this by hand. 24.2 24.6
Step by Step Solution
There are 3 Steps involved in it

Get step-by-step solutions from verified subject matter experts