

Question: Sample Size, 2 3 4 5 6 7 8 9 10 12 n Mean Factor, A2 1.880 1.023 .729 .577 .483 .419 .373 .337 308
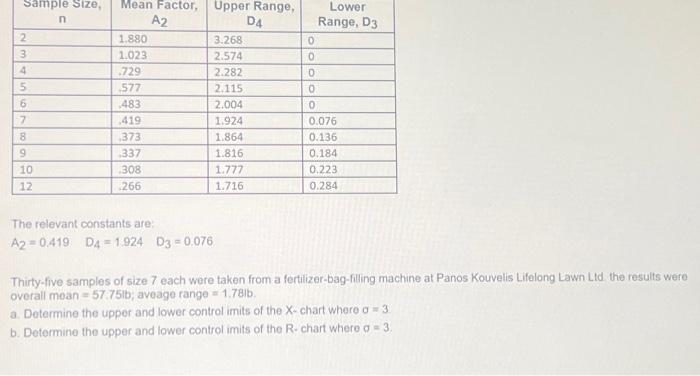
Sample Size, 2 3 4 5 6 7 8 9 10 12 n Mean Factor, A2 1.880 1.023 .729 .577 .483 .419 .373 .337 308 .266 The relevant constants are: A2 = 0.419 D4 = 1.924 D3 = 0.076 Upper Range, D4 3.268 2.574 2.282 2.115 2.004 1.924 1.864 1.816 1.777 1.716 0 0 0 0 0 Lower Range, D3 0.076 0.136 0.184 0.223 0.284 Thirty-five samples of size 7 each were taken from a fertilizer-bag-filling machine at Panos Kouvelis Lifelong Lawn Ltd. the results were overall mean = 57.75lb; aveage range = 1.78lb. a. Determine the upper and lower control imits of the X- chart where o = 3. b. Determine the upper and lower control imits of the R- chart where a = 3.
A2=0.419D4=1.924D3=0.076 Thirty-five samples of size 7 each were taken from a fertilizer-bag-filling machine at Panos Kouvelis Lifelong Lawn Lid the results were overall mean =57.75lb; aveage range =1.78lb. a. Dotermine the upper and lower controt imits of the X-chart where =3 b. Determine the upper and lower control imits of the R-chart where =3
Step by Step Solution
There are 3 Steps involved in it
1 Expert Approved Answer
Step: 1 Unlock

Question Has Been Solved by an Expert!
Get step-by-step solutions from verified subject matter experts
Step: 2 Unlock
Step: 3 Unlock