

Question: Sample Test 1 Unless otherwise stated, round all final answers to four decimal places. 1. In the state that you currently live, your commute to
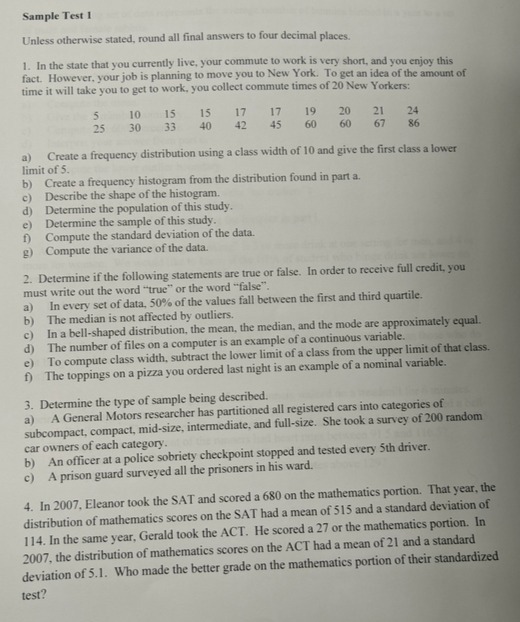
Sample Test 1 Unless otherwise stated, round all final answers to four decimal places. 1. In the state that you currently live, your commute to work is very short, and you enjoy this fact. However, your job is planning to move you to New York. To get an idea of the amount of time it will take you to get to work. you collect commute times of 20 New Yorkers: 5 10 15 15 17 17 19 20 21 24 25 30 33 40 42 45 60 60 67 86 a) Create a frequency distribution using a class width of 10 and give the first class a lower limit of 5. b) Create a frequency histogram from the distribution found in part a. c) Describe the shape of the histogram. dj Determine the population of this study. e) Determine the sample of this study. Compute the standard deviation of the data. g) Compute the variance of the data. 2. Determine if the following statements are true or false. In order to receive full credit, you must write out the word "true" or the word "false". a) In every set of data, 50% of the values fall between the first and third quartile. b) The median is not affected by outliers. In a bell-shaped distribution, the mean, the median, and the mode are approximately equal. d) The number of files on a computer is an example of a continuous variable. e) To compute class width, subtract the lower limit of a class from the upper limit of that class. f) The toppings on a pizza you ordered last night is an example of a nominal variable. 3. Determine the type of sample being described. a) A General Motors researcher has partitioned all registered cars into categories of subcompact, compact, mid-size, intermediate, and full-size. She took a survey of 200 random car owners of each category. b) An officer at a police sobriety checkpoint stopped and tested every 5th driver. c) A prison guard surveyed all the prisoners in his ward. 4. In 2007, Eleanor took the SAT and scored a 680 on the mathematics portion. That year, the distribution of mathematics scores on the SAT had a mean of 515 and a standard deviation of 1 14. In the same year, Gerald took the ACT. He scored a 27 or the mathematics portion. In 2007, the distribution of mathematics scores on the ACT had a mean of 21 and a standard deviation of 5.1. Who made the better grade on the mathematics portion of their standardized test
Step by Step Solution
There are 3 Steps involved in it

Get step-by-step solutions from verified subject matter experts