

Question: Write a function plot_comparison(t, x, xharmonic, ylabel) that takes as input t: a numpy array to times; x: a numpy array of observables for
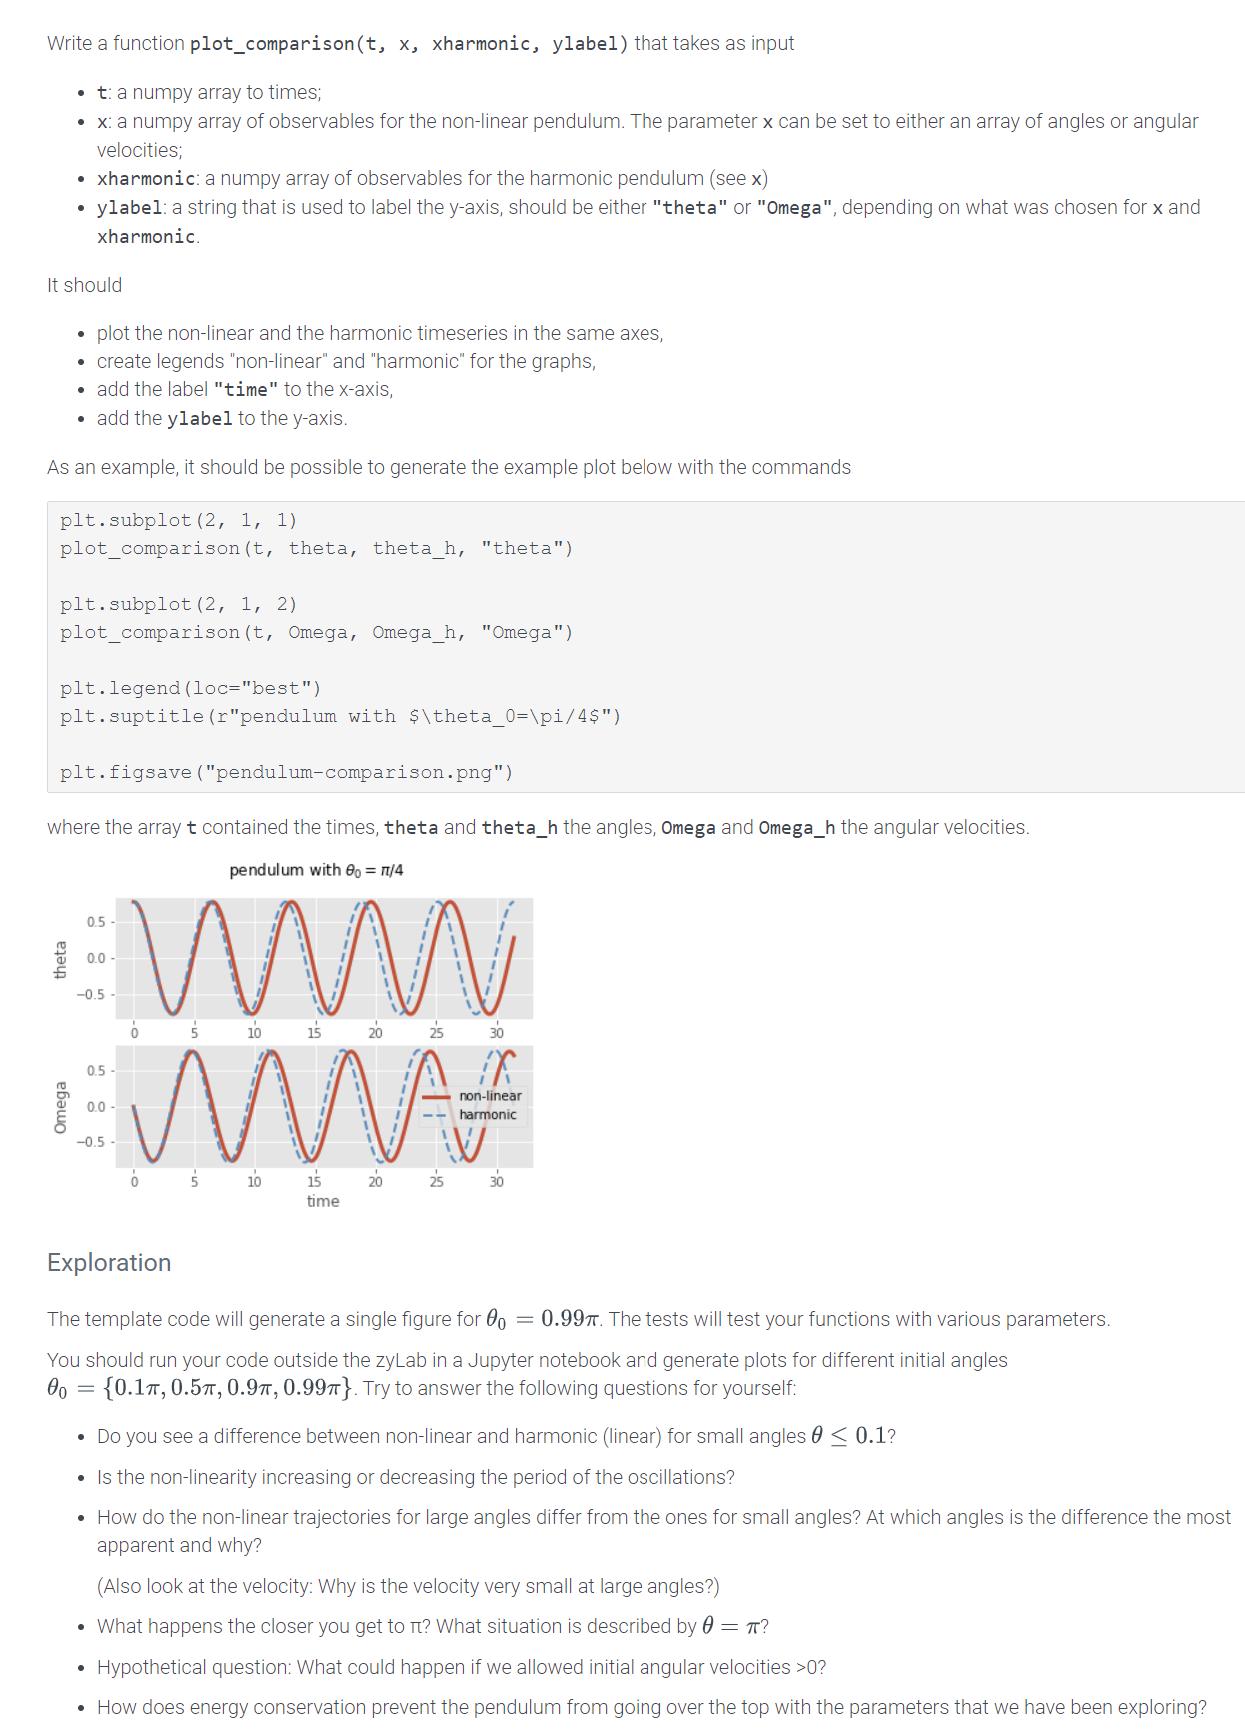
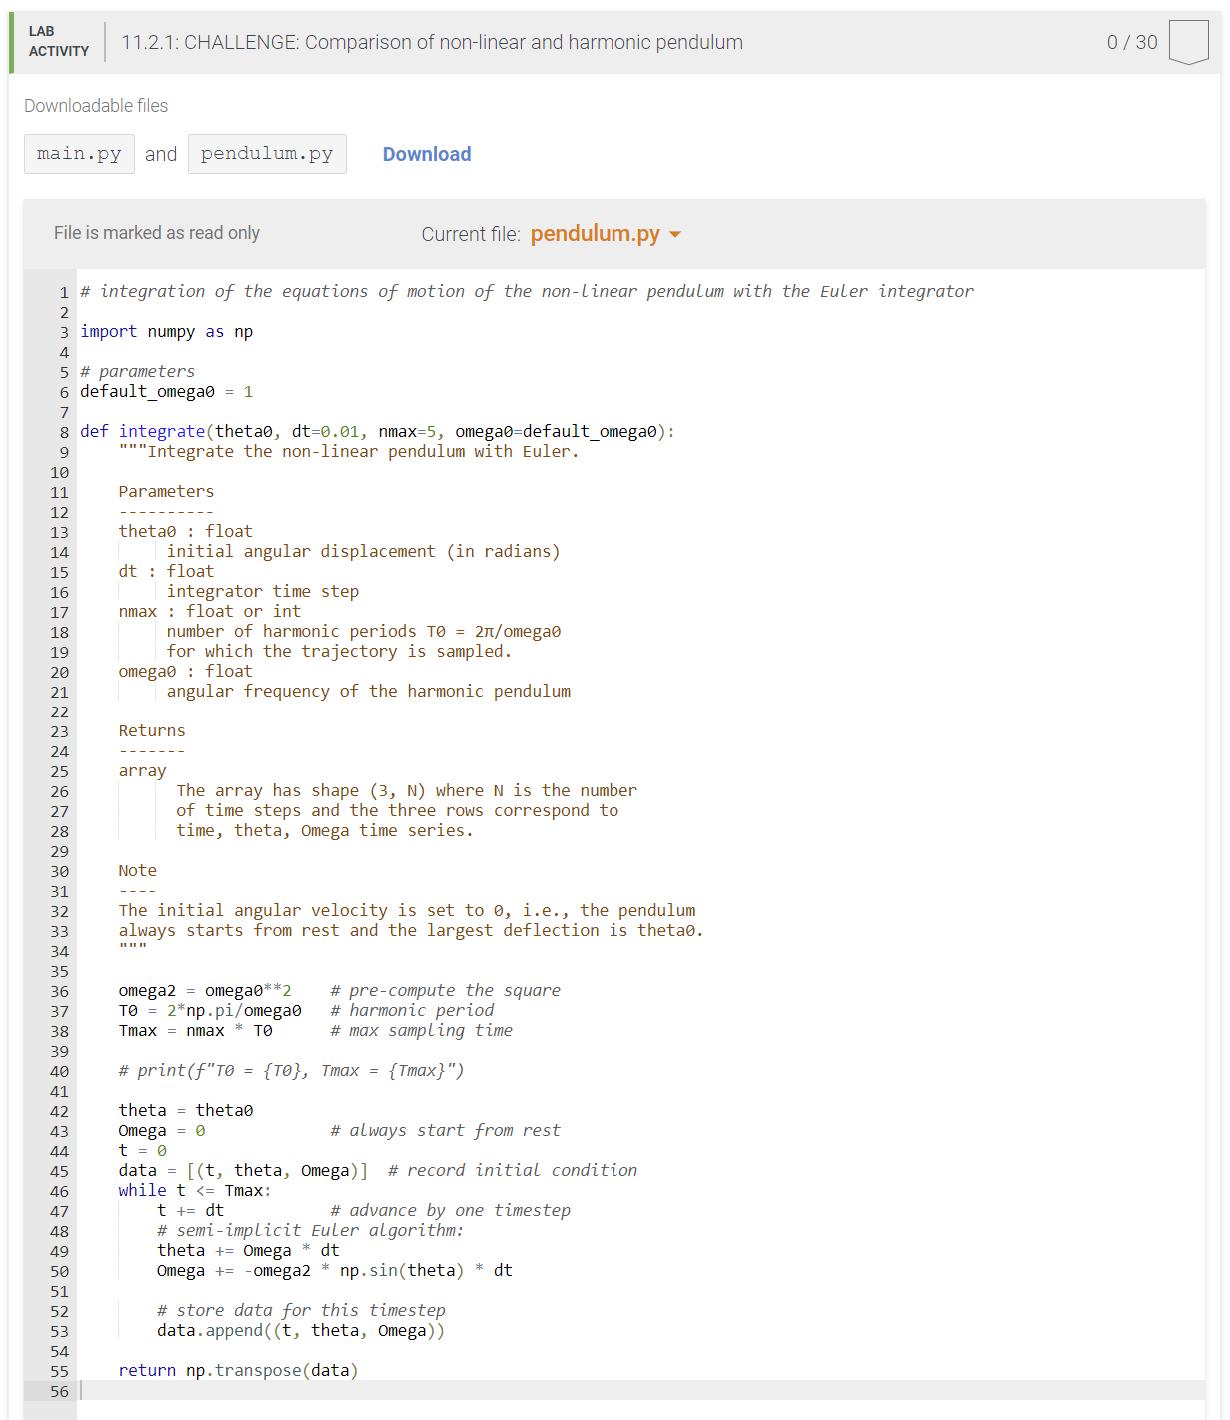
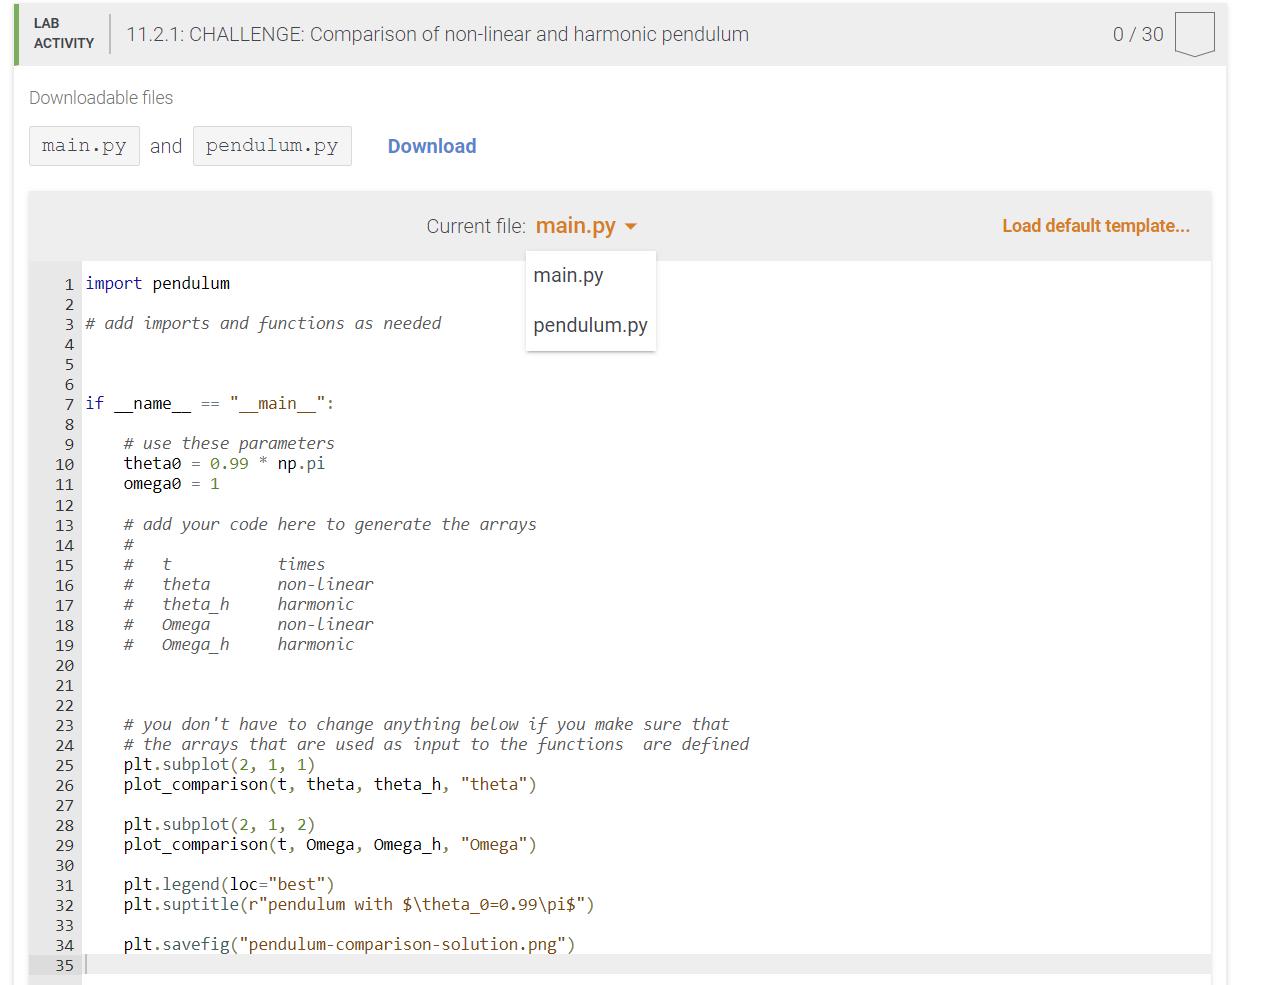

Write a function plot_comparison(t, x, xharmonic, ylabel) that takes as input t: a numpy array to times; x: a numpy array of observables for the non-linear pendulum. The parameter x can be set to either an array of angles or angular velocities; xharmonic: a numpy array of observables for the harmonic pendulum (see x) ylabel: a string that is used to label the y-axis, should be either "theta" or "Omega", depending on what was chosen for x and xharmonic. It should plot the non-linear and the harmonic timeseries in the same axes, create legends "non-linear" and "harmonic" for the graphs, add the label "time" to the x-axis, add the ylabel to the y-axis. As an example, it should be possible to generate the example plot below with the commands plt.subplot (2, 1, 1) plot_comparison (t, theta, theta_h, "theta") plt.subplot (2, 1, 2) plot_comparison (t, Omega, Omega_h, "Omega") plt.legend (loc="best") plt.suptitle (r"pendulum with $\theta_0=\pi/4$") plt.figsave ("pendulum-comparison.png") where the array t contained the times, theta and theta_h the angles, Omega and Omega_h the angular velocities. pendulum with 0o = 1/4 ww 15 theta 0.5- 0.0 -0.5- 0.5- 10 25 30 non-linear #MMA # harmonic 10 0.0- -0.5 0 5 20 15 time 20 25 Exploration The template code will generate a single figure for 00 = 0.997. The tests will test your functions with various parameters. You should run your code outside the zyLab in a Jupyter notebook and generate plots for different initial angles 00 = {0.1, 0.5, 0.9, 0.99}. Try to answer the following questions for yourself: Do you see a difference between non-linear and harmonic (linear) for small angles 0 0.1? Is the non-linearity increasing or decreasing the period of the oscillations? How do the non-linear trajectories for large angles differ from the ones for small angles? At which angles is the difference the most apparent and why? (Also look at the velocity: Why is the velocity very small at large angles?) What happens the closer you get to it? What situation is described by 0 = ? Hypothetical question: What could happen if we allowed initial angular velocities >0? How does energy conservation prevent the pendulum from going over the top with the parameters that we have been exploring?
Step by Step Solution
3.42 Rating (149 Votes )
There are 3 Steps involved in it
Answer import matplotlibpyplot as plt import numpy as np De... View full answer

Get step-by-step solutions from verified subject matter experts