

Question: saturation for a water 8 b. Plot Pressure Temperature). U nter D in the best it for this graph. w olumes calculate 1/T and (I)
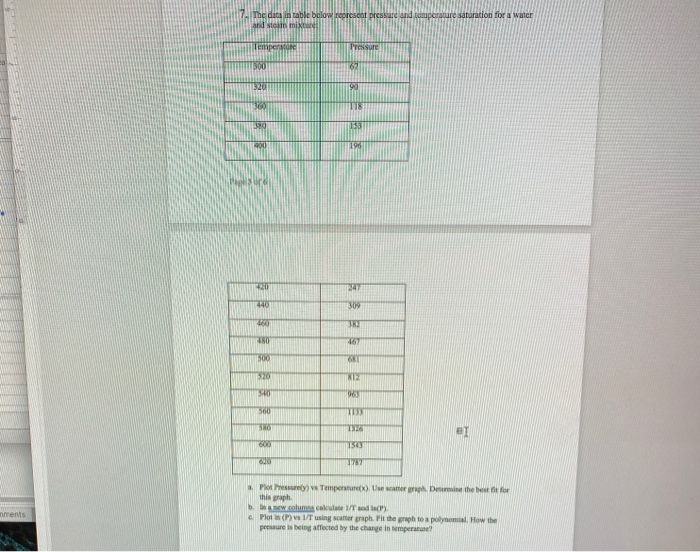
saturation for a water 8 b. Plot Pressure Temperature). U nter D in the best it for this graph. w olumes calculate 1/T and (I) Plotin (P) 1/T using scatter graph Pit the graph to a polynomial How the pessure is being affected by the change in temperature mens
Step by Step Solution
There are 3 Steps involved in it
1 Expert Approved Answer
Step: 1 Unlock

Question Has Been Solved by an Expert!
Get step-by-step solutions from verified subject matter experts
Step: 2 Unlock
Step: 3 Unlock