

Question: Save = Homework: Section 1.3 Homework Question 7, Social Sc 1... HW Score: 49.17%, 3.93 of 8 points Part 14 O Points of The table
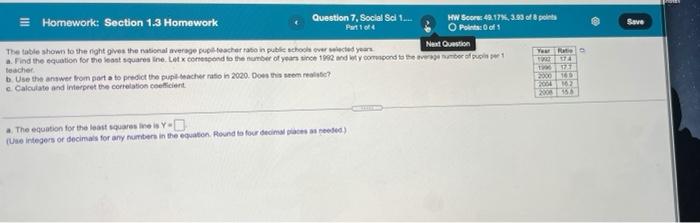
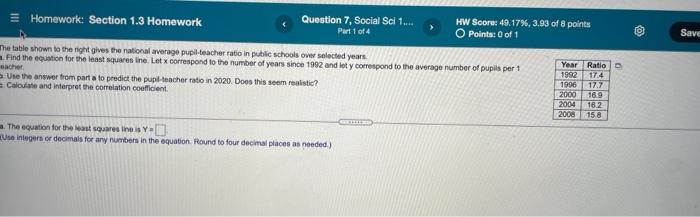
Save = Homework: Section 1.3 Homework Question 7, Social Sc 1... HW Score: 49.17%, 3.93 of 8 points Part 14 O Points of The table shown to the right gives the national average putocherato in public schools over lected years Ne Que YER a. Find the equation for the foot squares fine. Let correspond to the number of years since 1992 and tycomspond to the wonder of 1 teacher Two Use the answer from porta to predict the pup cacheraton 2020. Does this sente? 2000 101 e Calculate and interpret the correlation coefficient 2004 2005 a. The equation for the last sous- Usingers of decimals for any numbers in the equation. Round to four decide = Homework: Section 1.3 Homework Question 7, Social Sci 1... Part 1 of 4 HW Score: 49.17%, 3.93 of 8 points O Points: 0 of 1 Save The table shown to the night gives the national average pupil-teacher ratio in public schools over selected years Find the equation for the least squares ine. Let x correspond to the number of years since 1992 and let y correspond to the average number of pupils per 1 eacher Use the answer from part a to predict the pupil teacher ratio in 2020. Does this seem realistic? = Calculate and interpret the correlation coefficient - Year Ratio 1992 17.4 1996 17.7 2000 16.9 2004 16.2 2008 15.8 The equation for the seast squares in Y- Us Integers or decimals for any numbers in the equation Round to four decimal places as needed)
Step by Step Solution
There are 3 Steps involved in it

Get step-by-step solutions from verified subject matter experts