Question: Save Submit Assignment for Grading Problem 9:39 Algo Statistical Forecasting Models) Question of Hint(s) Check My Work Spreadsheet A restaurant wants to forecast its weekly
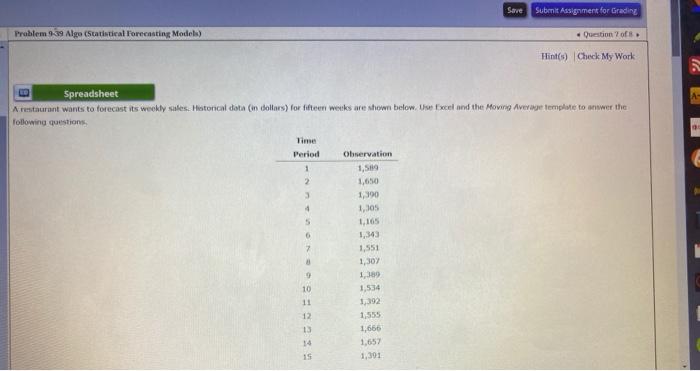
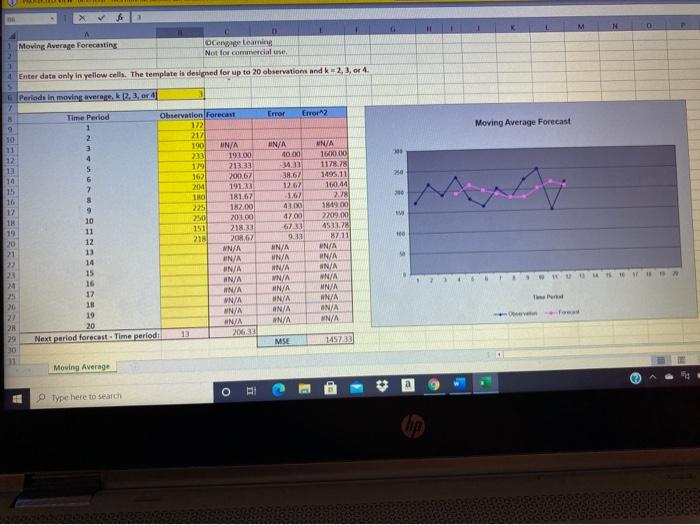
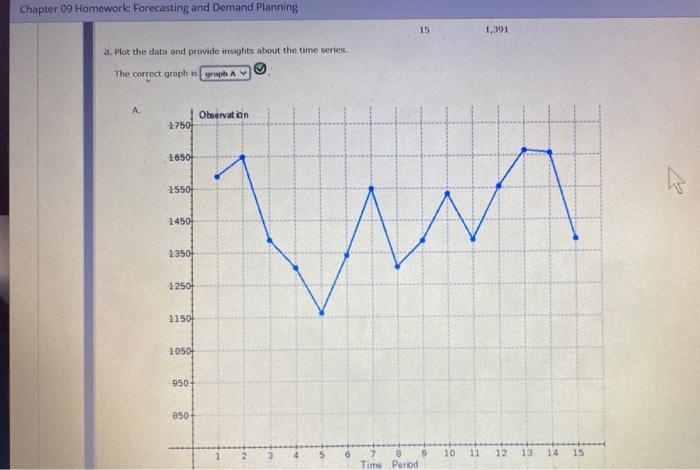
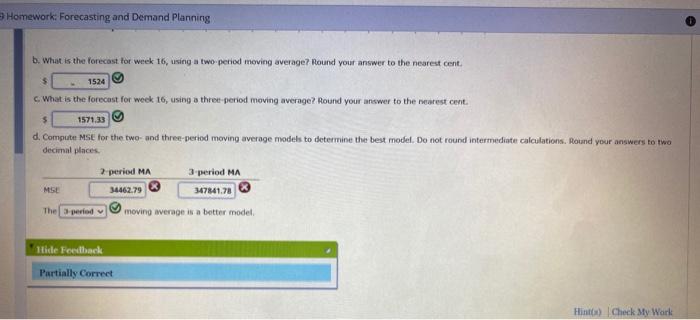
Save Submit Assignment for Grading Problem 9:39 Algo Statistical Forecasting Models) Question of Hint(s) Check My Work Spreadsheet A restaurant wants to forecast its weekly scales. Miestonical data (in doktors) for fifteen works are shown below. Use Excel and the Moving Average template to answer the Following questions, Period 1 2 3 4 5 6 7 Observation 1,569 1,650 1,390 1,305 1,165 1,343 1,551 1,307 1389 1,534 1,392 1,555 1,666 1,657 1,301 10 11 12 13 M N Moving Average Forecasting Cengage Learning Not to come aluse, 1 4 Enter data only in yellow cells. The template is designed for up to 20 observations and k2, 3, or Periods in moving average 12.3 or 4 Error Error2 Time Period Moving Average Forecast 2 N/A 100 250 B 9 10 11 12 11 14 15 16 17 18 19 20 23 22 Observation Forecast 172 217 190 WN/A 233 193000 119 2133 362 200.67 2014 191.33 TRO 181.67 225 182.00 250 201.00 151 218.33 218 2016 WN/A 200 40.00 134.33 38.67 12.67 1.67 43.00 4700 6231 011 N/A N/A N/A MN/A HN/A UN/A AN/A N/A 5 6 7 8 9 10 11 12 13 14 15 16 17 18 19 20 Next period forecast Time period WN/A 1600.00 1178.78 1495.11 160.44 2. 149.00 2209.00 45413,78 87.11 UN/A IN/A #N/A WN/A MN/A #N/A N/A WN/A 100 IN/A 110TR IN/A #N/A #N/A WN/A MN/A UNIA 25 20 21 2 20 30 11 MS 145233 Moving Average O Type here to search Chapter 09 Homework: Forecasting and Demand Planning 15 1,391 a. Plot the data and provide insights about the time series, The correct graph is graph AM A. Observation 1750 16507 15501 1450) um 1350 1250 1150 10501 950 850 10 11 12 13 14 15 Time Period Homework: Forecasting and Demand Planning $ b. What is the forecast for week 16, using two period moving average? Round your answer to the nearest cent 1524 What is the forecast for week 16, using a three-period moving average? Round your answer to the poorest cont. 1571.33 d. Compute MSt for the two and three-period moving average models to determine the best model. Do not round Intermediate calculations. Round your answers to two decimal places. 2 period MA 3 period MA 34462.79 347841.78 MSE The period moving average is a better model Hide Feetback Partially Correct Hint) Check My Work Save Submit Assignment for Grading Problem 9:39 Algo Statistical Forecasting Models) Question of Hint(s) Check My Work Spreadsheet A restaurant wants to forecast its weekly scales. Miestonical data (in doktors) for fifteen works are shown below. Use Excel and the Moving Average template to answer the Following questions, Period 1 2 3 4 5 6 7 Observation 1,569 1,650 1,390 1,305 1,165 1,343 1,551 1,307 1389 1,534 1,392 1,555 1,666 1,657 1,301 10 11 12 13 M N Moving Average Forecasting Cengage Learning Not to come aluse, 1 4 Enter data only in yellow cells. The template is designed for up to 20 observations and k2, 3, or Periods in moving average 12.3 or 4 Error Error2 Time Period Moving Average Forecast 2 N/A 100 250 B 9 10 11 12 11 14 15 16 17 18 19 20 23 22 Observation Forecast 172 217 190 WN/A 233 193000 119 2133 362 200.67 2014 191.33 TRO 181.67 225 182.00 250 201.00 151 218.33 218 2016 WN/A 200 40.00 134.33 38.67 12.67 1.67 43.00 4700 6231 011 N/A N/A N/A MN/A HN/A UN/A AN/A N/A 5 6 7 8 9 10 11 12 13 14 15 16 17 18 19 20 Next period forecast Time period WN/A 1600.00 1178.78 1495.11 160.44 2. 149.00 2209.00 45413,78 87.11 UN/A IN/A #N/A WN/A MN/A #N/A N/A WN/A 100 IN/A 110TR IN/A #N/A #N/A WN/A MN/A UNIA 25 20 21 2 20 30 11 MS 145233 Moving Average O Type here to search Chapter 09 Homework: Forecasting and Demand Planning 15 1,391 a. Plot the data and provide insights about the time series, The correct graph is graph AM A. Observation 1750 16507 15501 1450) um 1350 1250 1150 10501 950 850 10 11 12 13 14 15 Time Period Homework: Forecasting and Demand Planning $ b. What is the forecast for week 16, using two period moving average? Round your answer to the nearest cent 1524 What is the forecast for week 16, using a three-period moving average? Round your answer to the poorest cont. 1571.33 d. Compute MSt for the two and three-period moving average models to determine the best model. Do not round Intermediate calculations. Round your answers to two decimal places. 2 period MA 3 period MA 34462.79 347841.78 MSE The period moving average is a better model Hide Feetback Partially Correct Hint) Check My Work