

Question: Saved Help Save AS1 A$2 Price level -AD2 0 Q1 Q2 Q3 Real domestic output In the above figure, AD, and AS1 represent the original

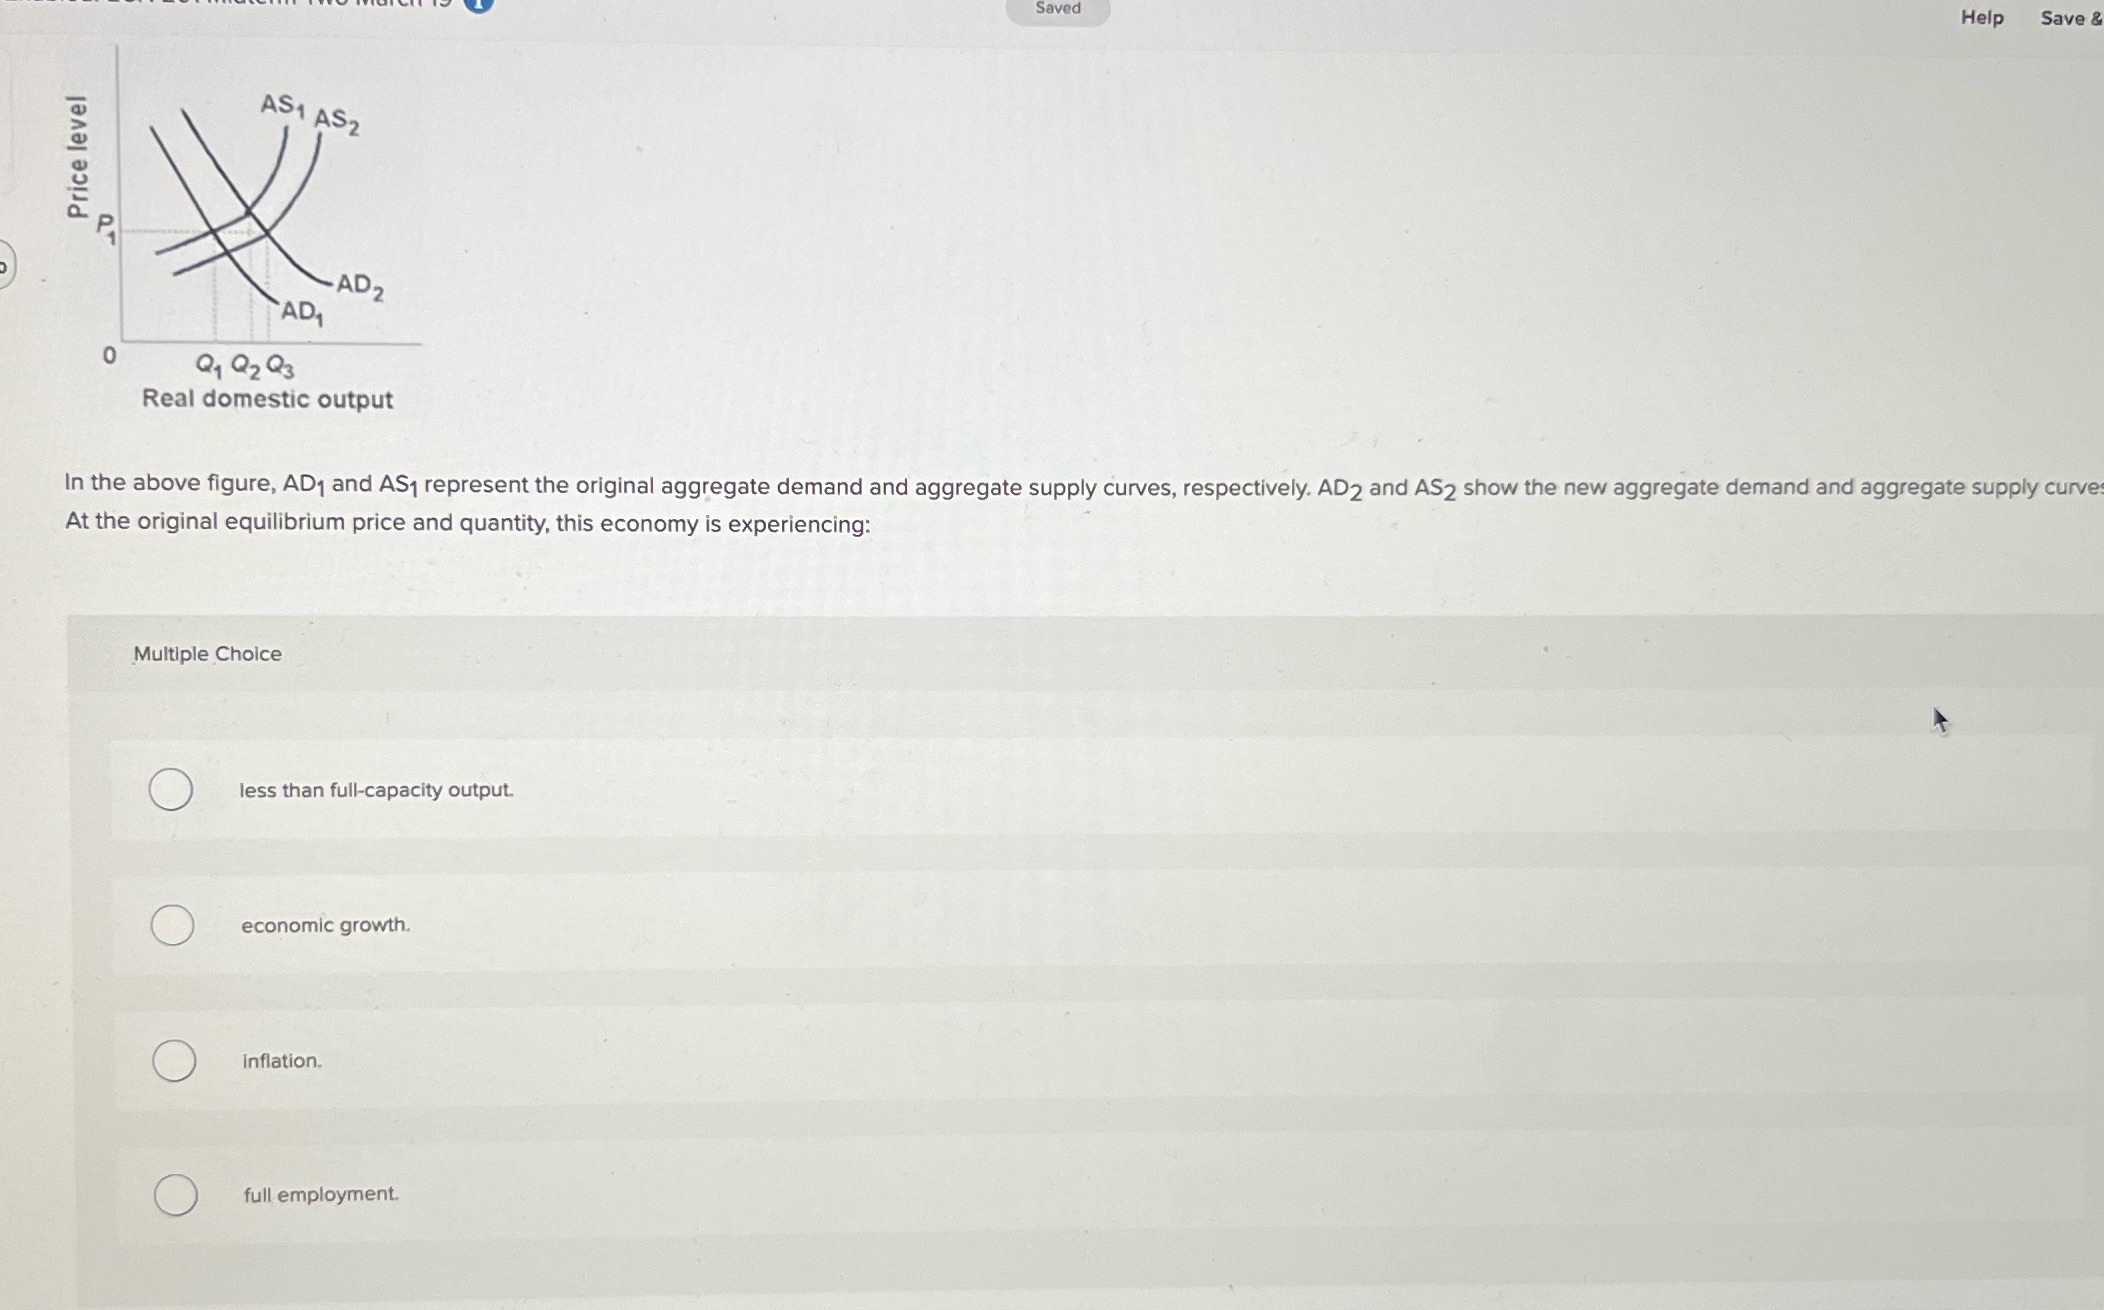
Saved Help Save AS1 A$2 Price level -AD2 0 Q1 Q2 Q3 Real domestic output In the above figure, AD, and AS1 represent the original aggregate demand and aggregate supply curves, respectively. AD2 and AS2 show the new aggregate demand and aggregate supply curve At the original equilibrium price and quantity, this economy is experiencing: Multiple Choice O less than full-capacity output. economic growth. O inflation. O full employment
Step by Step Solution
There are 3 Steps involved in it
1 Expert Approved Answer
Step: 1 Unlock

Question Has Been Solved by an Expert!
Get step-by-step solutions from verified subject matter experts
Step: 2 Unlock
Step: 3 Unlock