

Question: Scatberplot of Sales vs Experieme The shown scatter-plot shows monthly sales figures (in units) and number of months of experience on the job for a
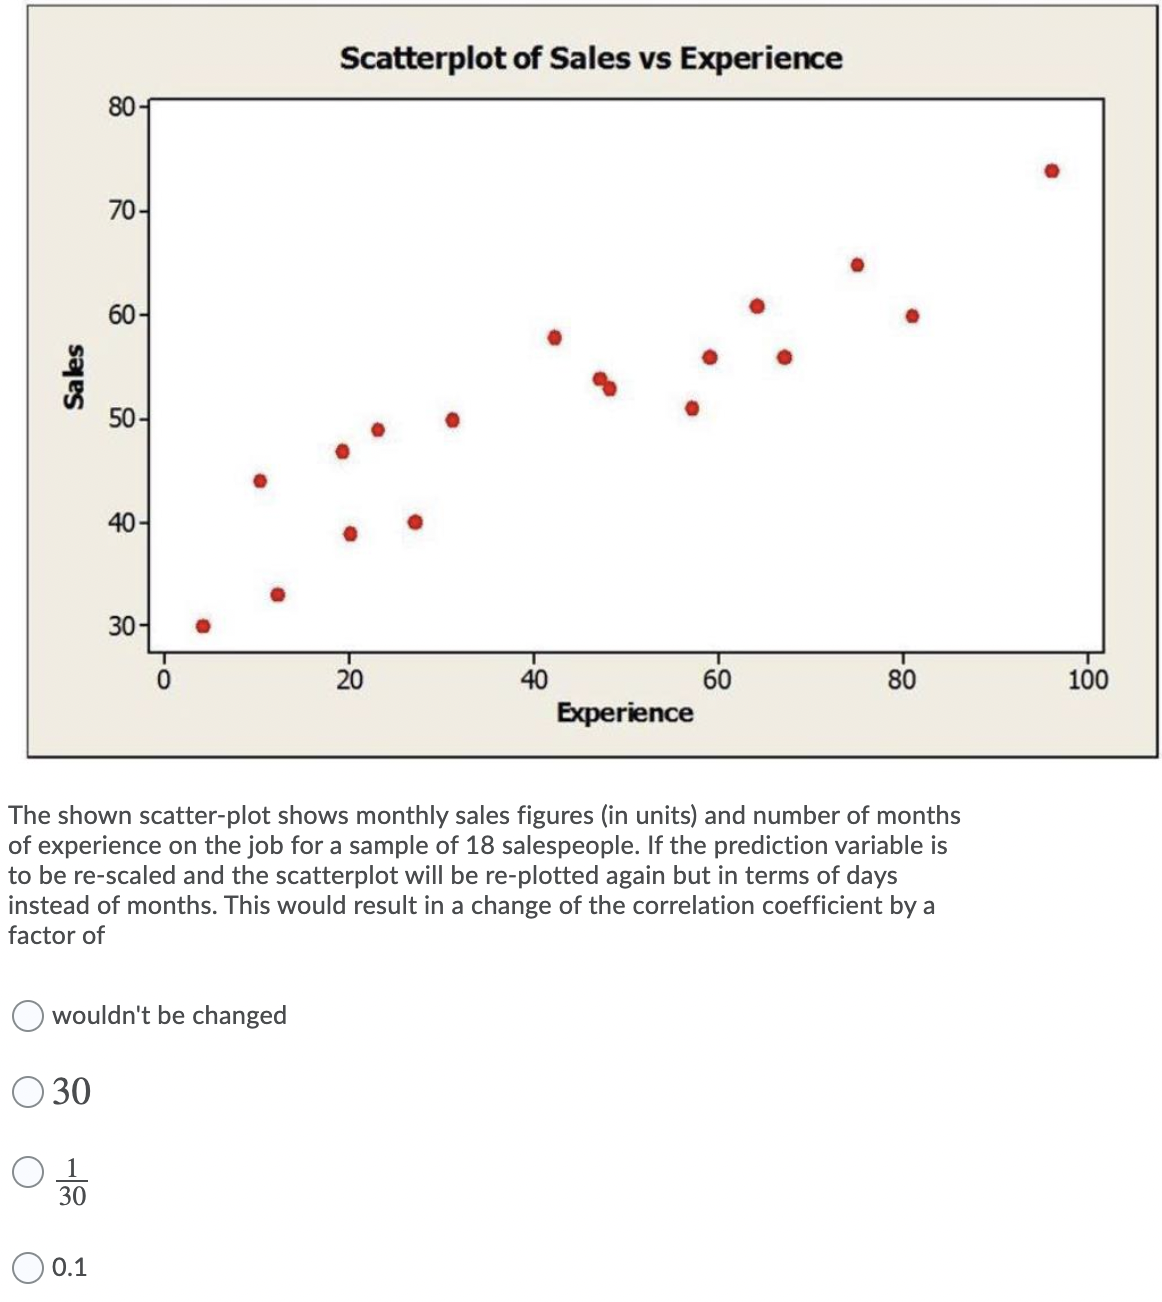
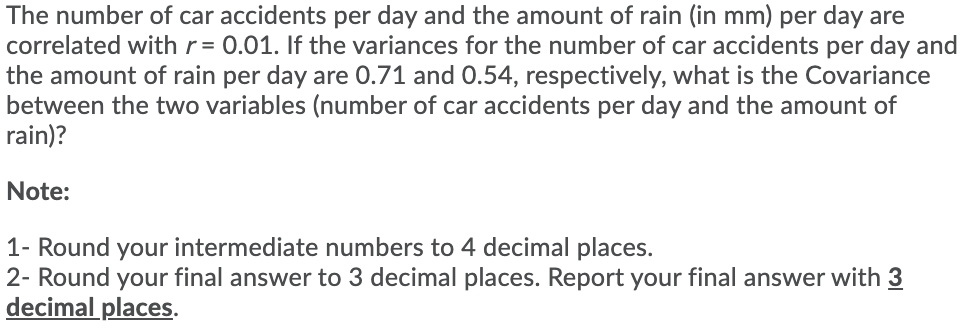
Scatberplot of Sales vs Experieme The shown scatter-plot shows monthly sales figures (in units) and number of months of experience on the job for a sample of 18 salespeople. If the prediction variable is to be re-scaled and the scatterplot will be re-plotted again but in terms of days instead of months. This would result in a change of the correlation coefficient by a factor of O wouldn't be changed 030 O; 30 O 0.1 The number of car accidents per day and the amount of rain (in mm) per day are correlated with r= 0.01. If the variances for the number of car accidents per day and the amount of rain per day are 0.71 and 0.54, respectively, what is the Covariance between the two variables (number of car accidents per day and the amount of rain)? Note: 1- Round your intermediate numbers to 4 decimal places. 2- Round your final answer to 3 decimal places. Report your final answer with g decimal places
Step by Step Solution
There are 3 Steps involved in it

Get step-by-step solutions from verified subject matter experts