

Question: Question 1 (1 point) The scatterplot shows monthly sales figures (in units) and number of months of experience for a sample of salespeople. Scatterplot of
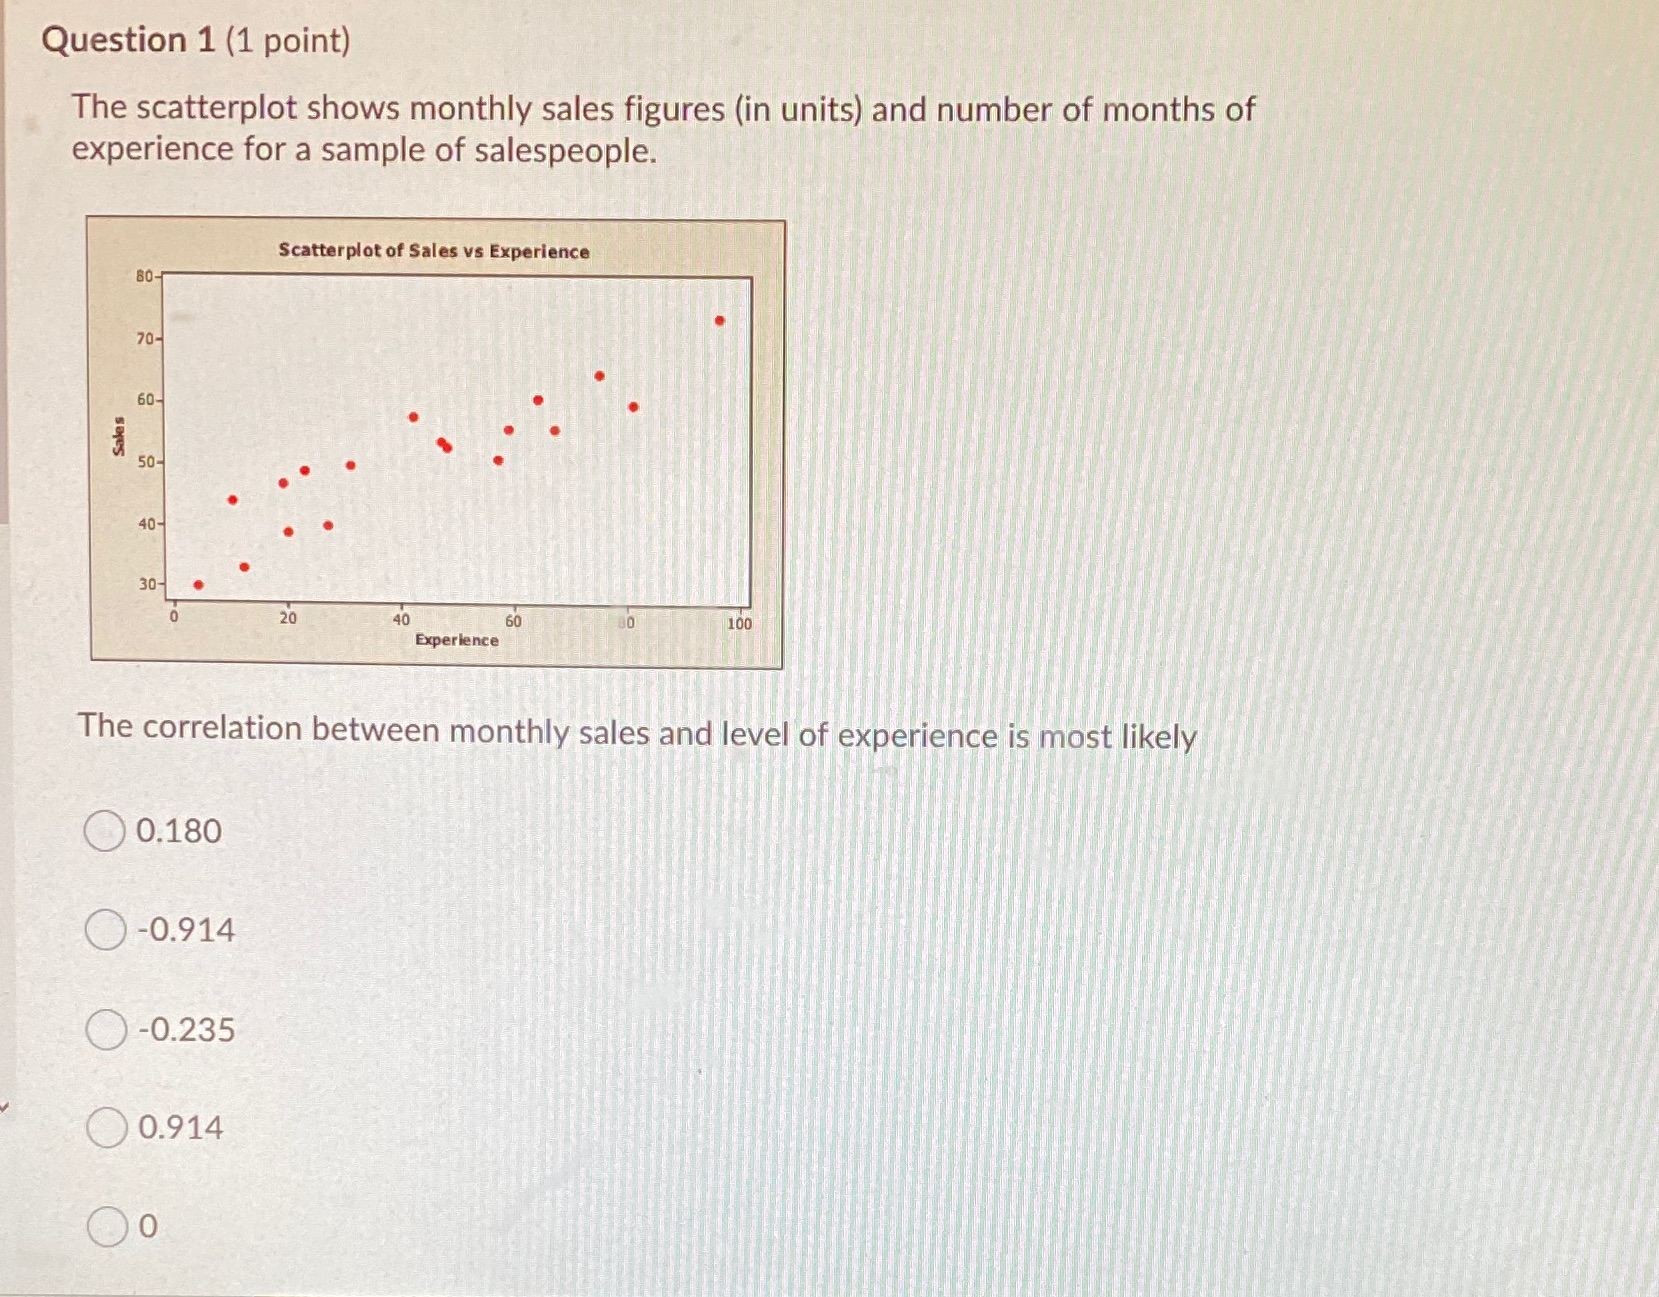
Question 1 (1 point) The scatterplot shows monthly sales figures (in units) and number of months of experience for a sample of salespeople. Scatterplot of Sales vs Experience 80- 70 50 Sales 50 40 30 20 40 Experience 60 80 100 The correlation between monthly sales and level of experience is most likely 0.180 O-0.914 O-0.235 O 0.914 Oo
Step by Step Solution
There are 3 Steps involved in it
1 Expert Approved Answer
Step: 1 Unlock

Question Has Been Solved by an Expert!
Get step-by-step solutions from verified subject matter experts
Step: 2 Unlock
Step: 3 Unlock