

Question: Scatter Plot and Pearson r). Learning Activity No. 1 Graph, compute and interpret the Pearson Product Correlation Coefficient. i w 4 5 y 7 12
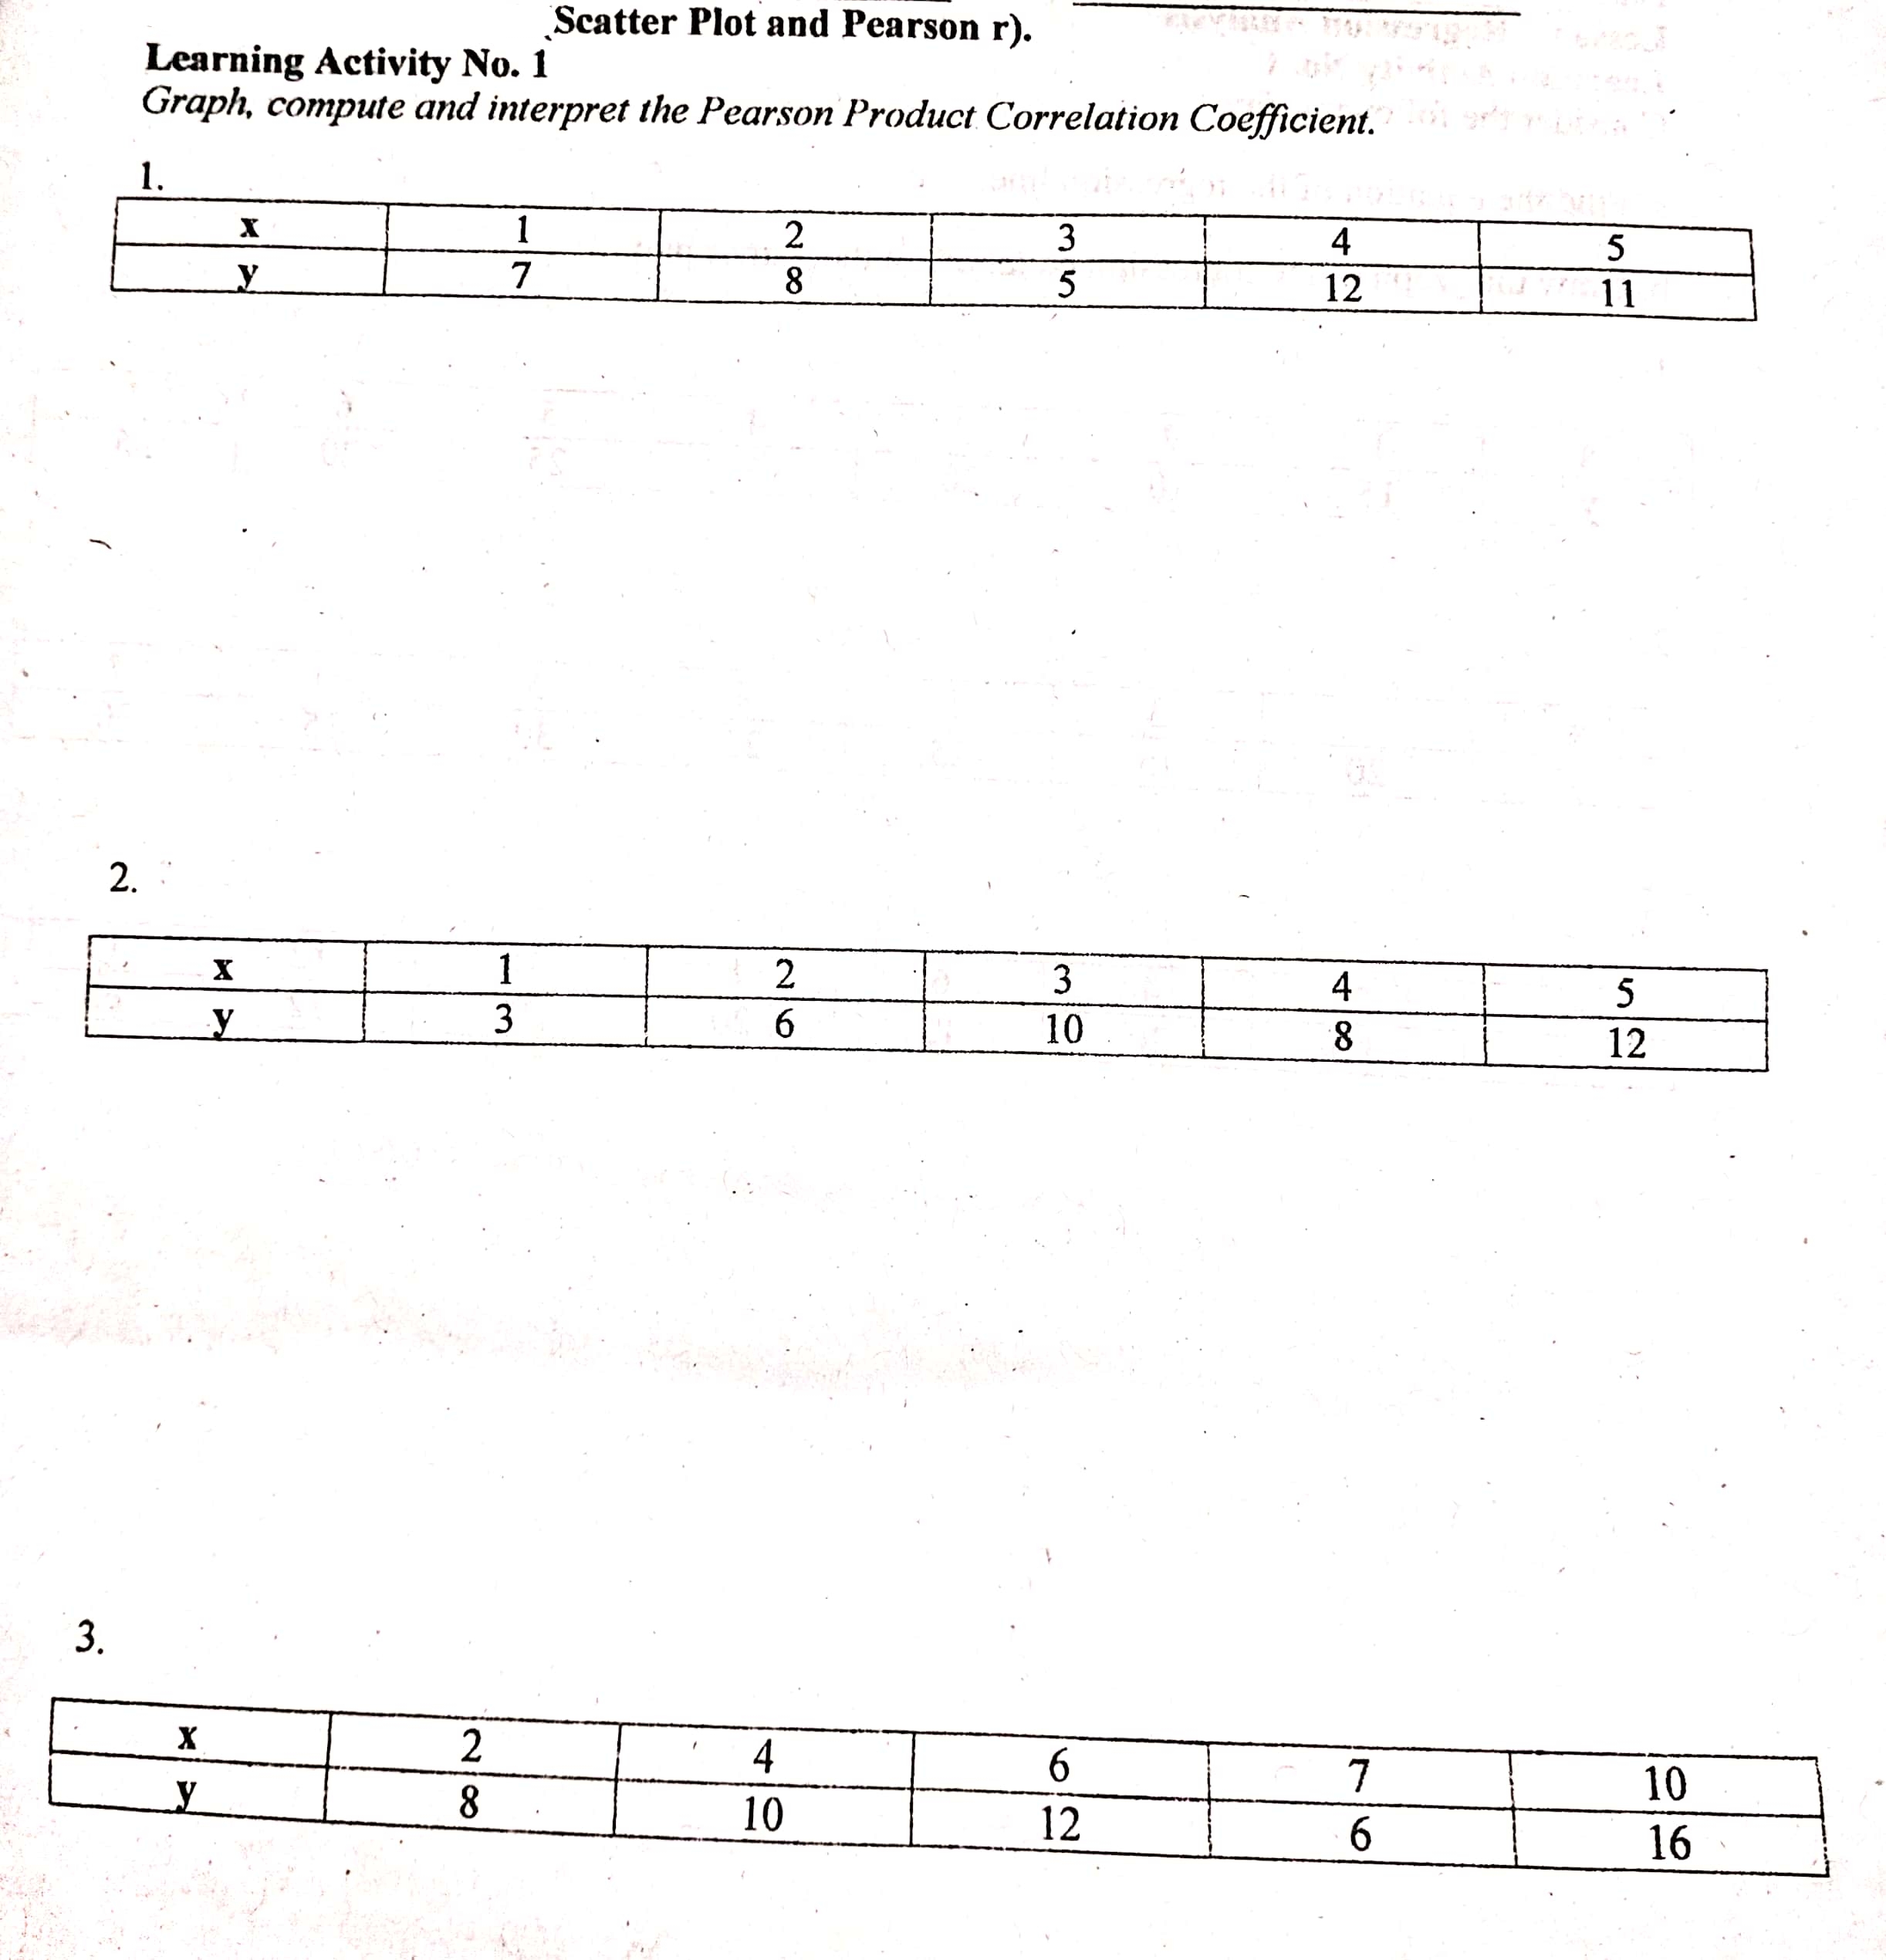
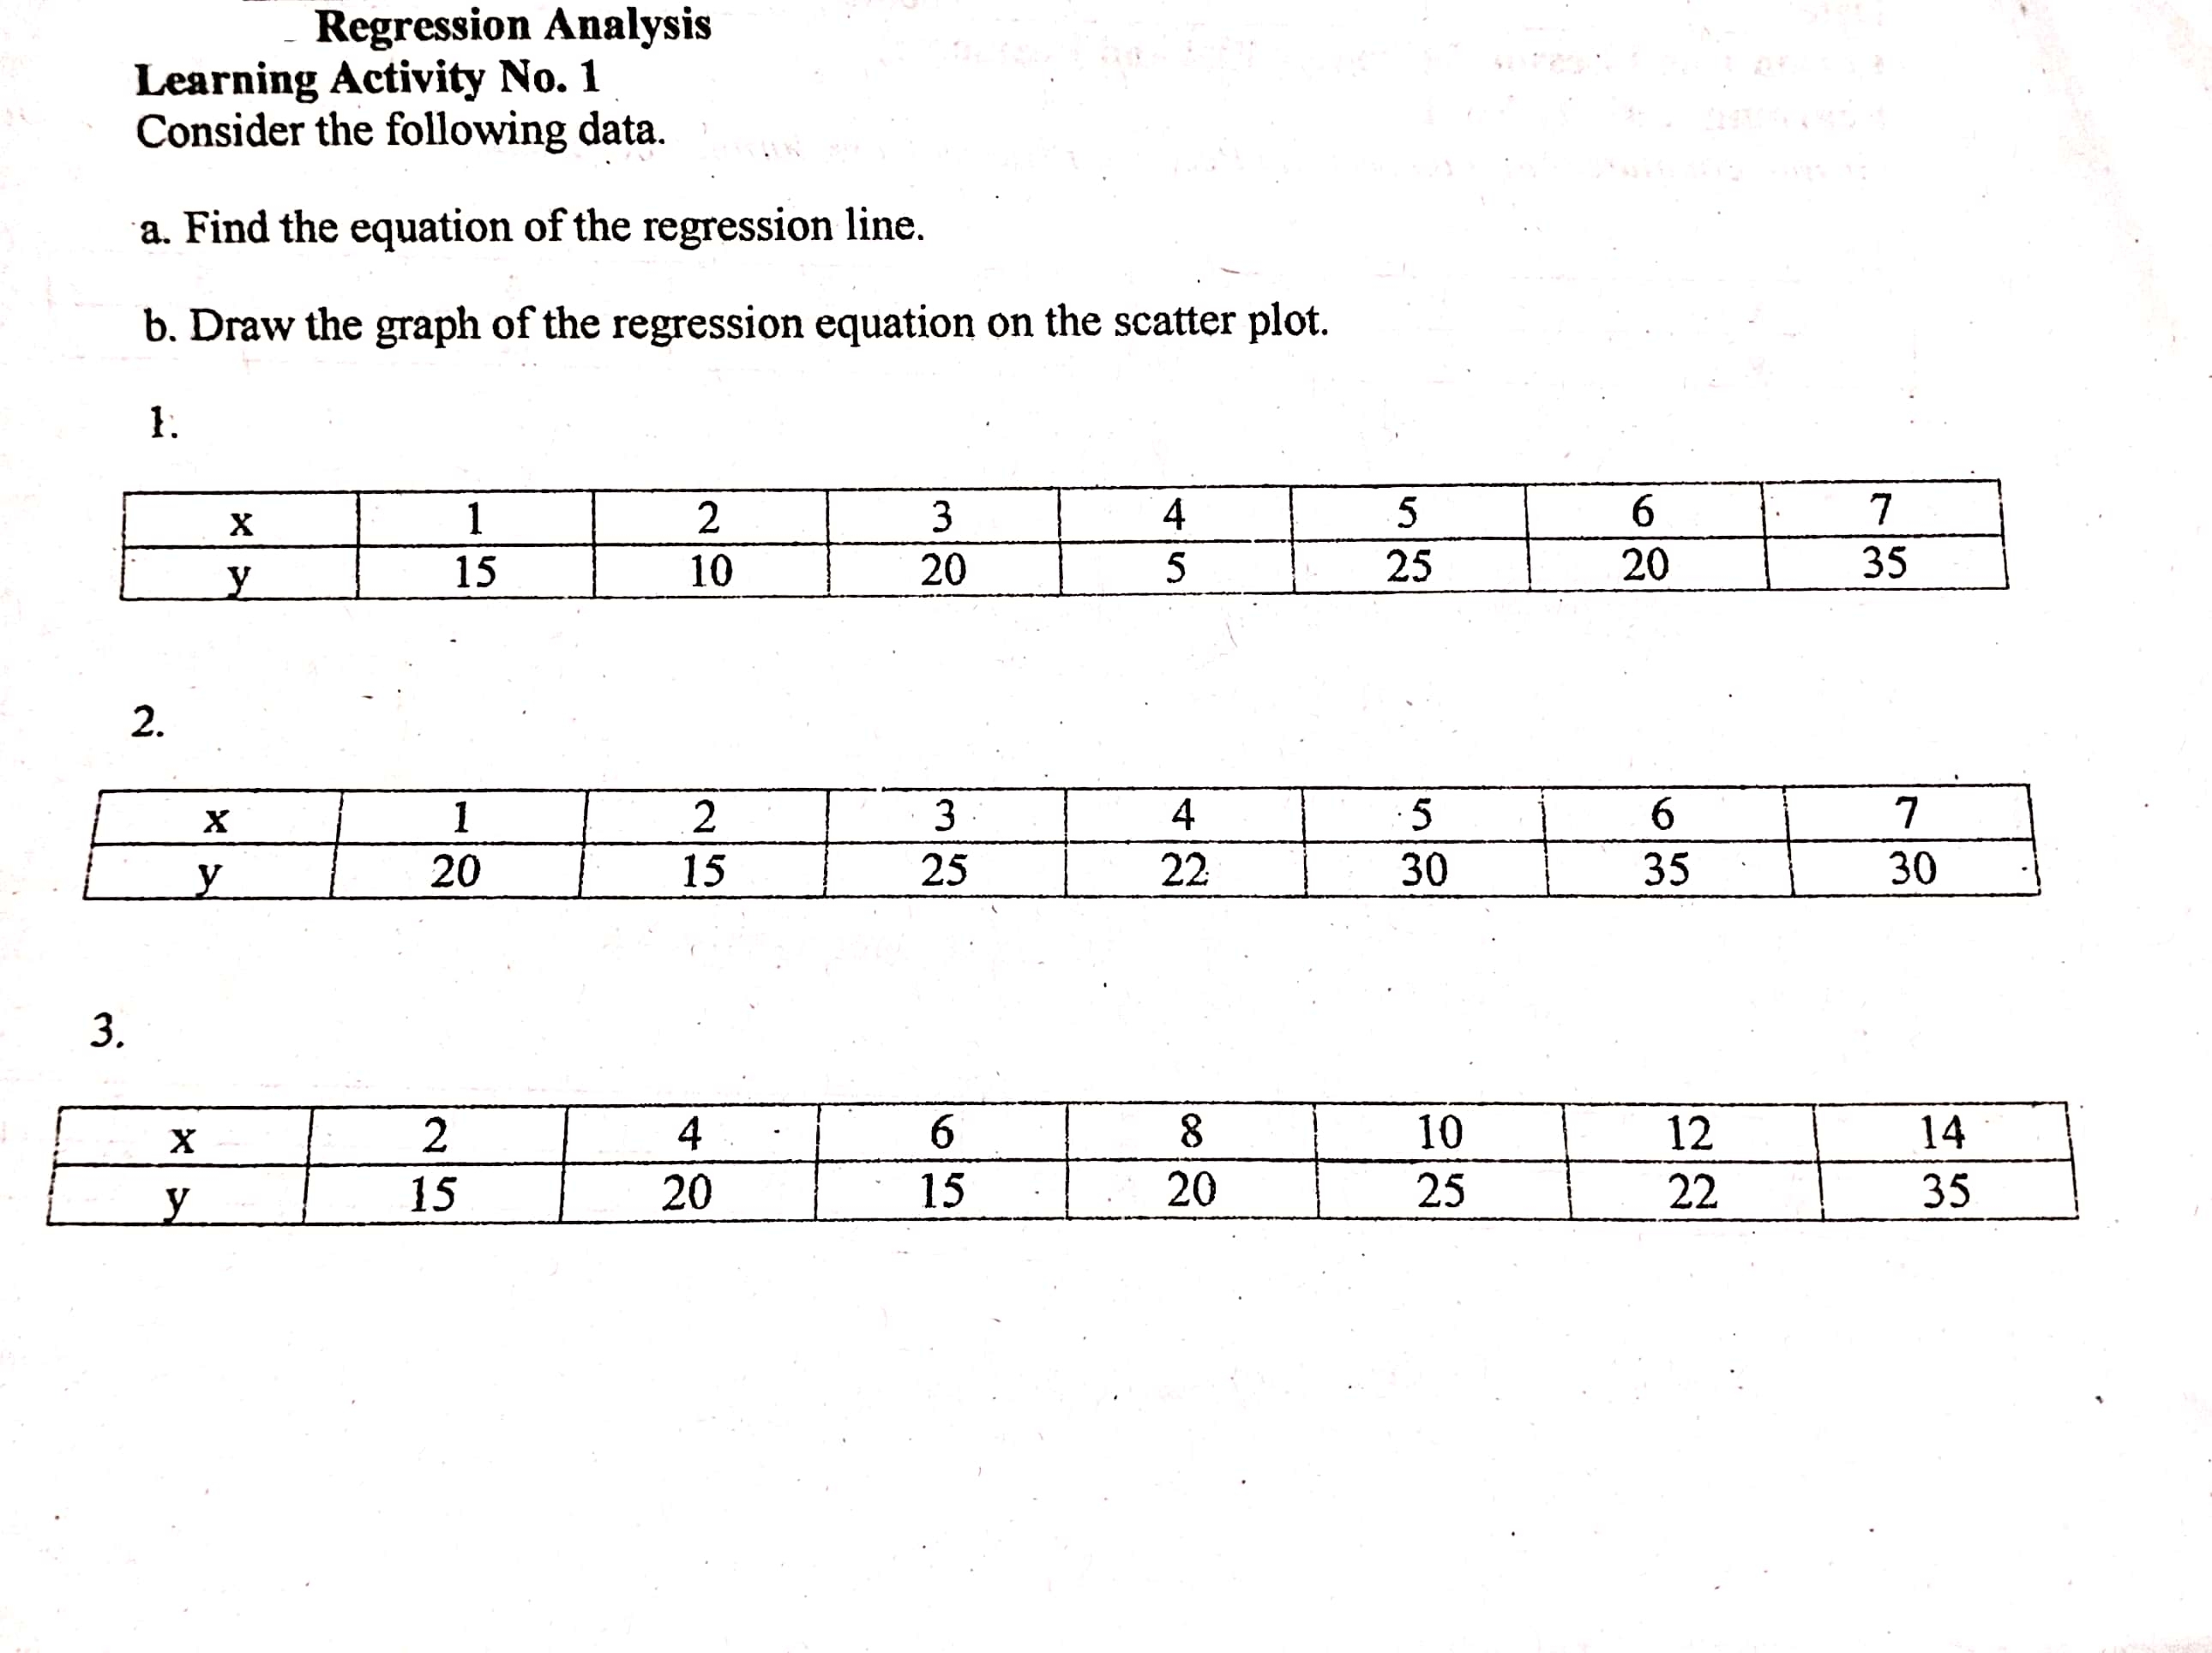
Scatter Plot and Pearson r). Learning Activity No. 1 Graph, compute and interpret the Pearson Product Correlation Coefficient. i w 4 5 y 7 12 11 2. . 1 w 5 ON 10 12 3. 6 Do N y 10 10 12 6 16Regression Analysis Learning Activity No. 1 Consider the following data. a. Find the equation of the regression line. b. Draw the graph of the regression equation on the scatter plot. 1. X 1 2 3 5 6 7 y 15 10 20 25 20 35 2. X 2 3 4 5 6 7 y 20 15 25 22 30 35 30 3. X 2 4 6 8 10 12 14 15 20 15 20 25 22 35
Step by Step Solution
There are 3 Steps involved in it
1 Expert Approved Answer
Step: 1 Unlock

Question Has Been Solved by an Expert!
Get step-by-step solutions from verified subject matter experts
Step: 2 Unlock
Step: 3 Unlock