

Question: Scatter plots are used to discover relationships between variables. Using the corresponding measurements of variable1 and variable2 in DATA, plot variable1 vs. variable2 and describe

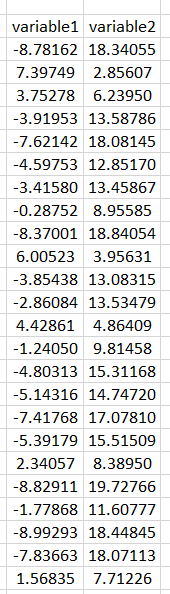
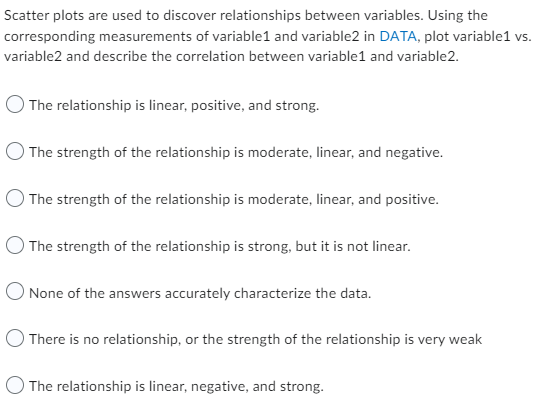

Scatter plots are used to discover relationships between variables. Using the corresponding measurements of variable1 and variable2 in DATA, plot variable1 vs. variable2 and describe the correlation between variable1 and variable2. The relationship is linear, positive, and strong. The strength of the relationship is moderate, linear, and negative. The strength of the relationship is moderate, linear, and positive. The strength of the relationship is strong, but it is not linear. ONone of the answers accurately characterize the data. There is no relationship, or the strength of the relationship is very weak The relationship is linear, negative, and strong.
Step by Step Solution
There are 3 Steps involved in it

Get step-by-step solutions from verified subject matter experts