

Question: Scatterplot Include a trend line and the regression equation. Label the axes. Median Listing Price ($) VS Median Square Footage 1,000,000 300,000 * - 800,000
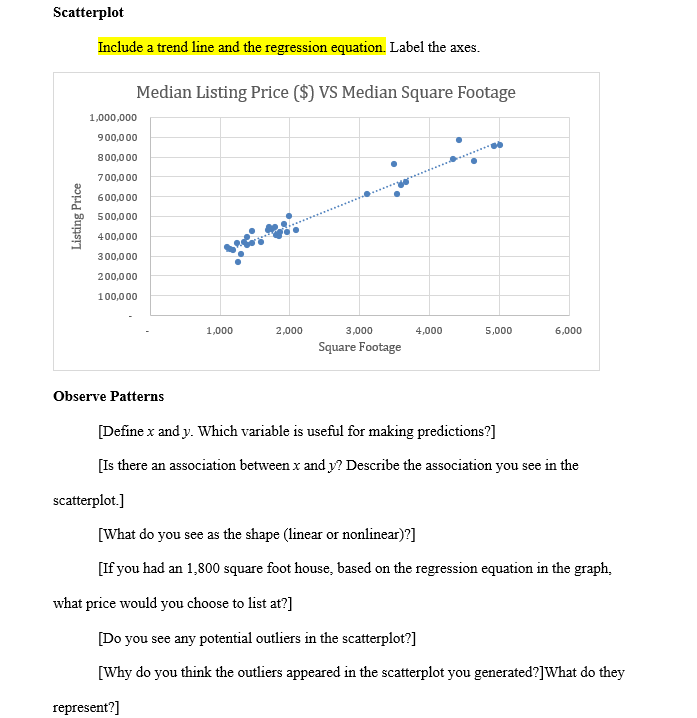
Scatterplot Include a trend line and the regression equation. Label the axes. Median Listing Price ($) VS Median Square Footage 1,000,000 300,000 * - 800,000 " 700,000 ', 600,000 500,000 o 400,000 ':%" 300,000 Listing Price 200,000 100,000 1,000 2,000 3,000 4,000 5.000 6,000 Square Footage Observe Patterns [Define x and y. Which varnable 1s useful for making predictions?] [Is there an association between x and 17 Describe the association you see 1n the scatterplot.] [What do you see as the shape (linear or nonlinear)?] [If you had an 1,800 square foot house, based on the regression equation in the graph, what price would you choose to list at?] [Do vou see any potential outliers in the scatterplot?] [Why do vou think the outliers appeared in the scatterplot you generated?]What do they represent?]
Step by Step Solution
There are 3 Steps involved in it

Get step-by-step solutions from verified subject matter experts