

Question: Scatterplot off %Broken chips vs % Potato Histe gram Versus Fits 10- (response to 'sbroken chipa) broken chips Residual 14 -1 50 -4.75 4.73 1.30
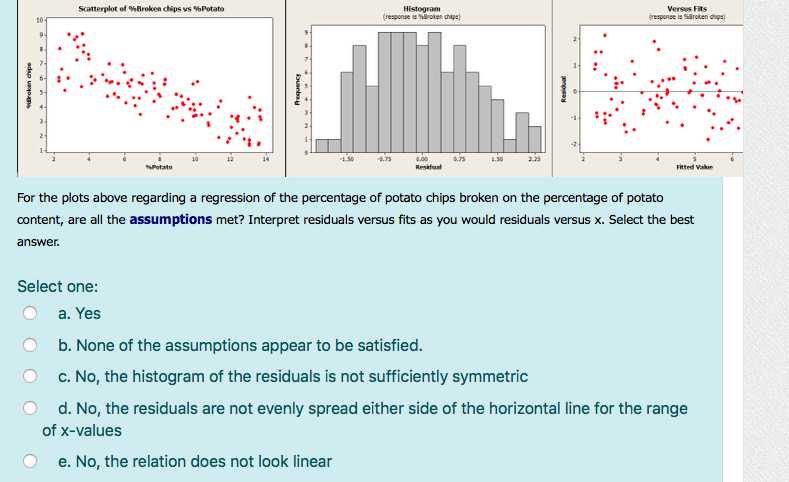
Scatterplot off %Broken chips vs % Potato Histe gram Versus Fits 10- (response to 'sbroken chipa) broken chips Residual 14 -1 50 -4.75 4.73 1.30 3.25 Potato Restful Fitted Value For the plots above regarding a regression of the percentage of potato chips broken on the percentage of potato content, are all the assumptions met? Interpret residuals versus fits as you would residuals versus x. Select the best answer. Select one: O a. Yes O b. None of the assumptions appear to be satisfied. O c. No, the histogram of the residuals is not sufficiently symmetric O d. No, the residuals are not evenly spread either side of the horizontal line for the range of x-values O e. No, the relation does not look linear
Step by Step Solution
There are 3 Steps involved in it

Get step-by-step solutions from verified subject matter experts